11 reasons computers can’t understand or solve our problems without human judgement

(Photo by Matt Gidley)

(Photo by Matt Gidley)

Why data is uncertain, cities are not programmable, and the world is not “algorithmic”.

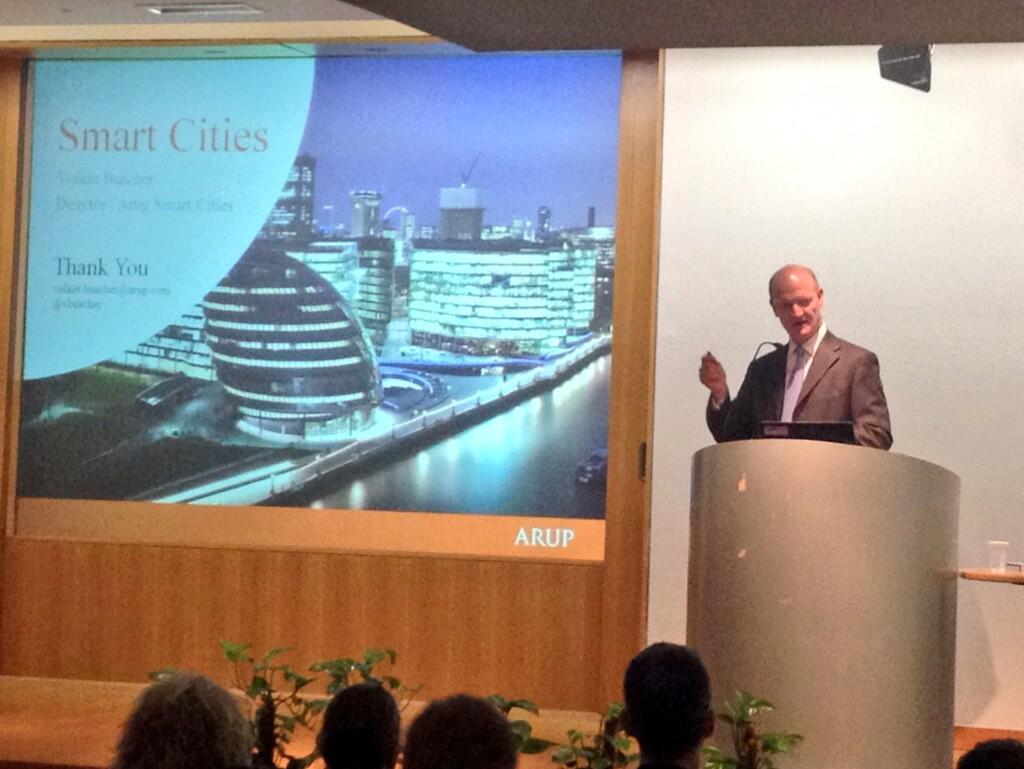
Many people are not convinced that the Smart Cities movement will result in the use of technology to make places, communities and businesses in cities better. Outside their consumer enjoyment of smartphones, social media and online entertainment – to the degree that they have access to them – they don’t believe that technology or the companies that sell it will improve their lives.

The technology industry itself contributes significantly to this lack of trust. Too often we overstate the benefits of technology, or play down its limitations and the challenges involved in using it well.

Most recently, the idea that traditional processes of government should be replaced by “algorithmic regulation” – the comparison of the outcomes of public systems to desired objectives through the measurement of data, and the automatic adjustment of those systems by algorithms in order to achieve them – has been proposed by Tim O’Reilly and other prominent technologists.

These approaches work in many mechanical and engineering systems – the autopilots that fly planes or the anti-lock braking systems that we rely on to stop our cars. But should we extend them into human realms – how we educate our children or how we rehabilitate convicted criminals?

It’s clearly important to ask whether it would be desirable for our society to adopt such approaches. That is a complex debate, but my personal view is that in most cases the incredible technologies available to us today – and which I write about frequently on this blog – should not be used to take automatic decisions about such issues. They are usually more valuable when they are used to improve the information and insight available to human decision-makers – whether they are politicians, public workers or individual citizens – who are then in a better position to exercise good judgement.

More fundamentally, though, I want to challenge whether “algorithmic regulation” or any other highly deterministic approach to human issues is even possible. Quite simply, it is not.

It is true that our ability to collect, analyse and interpret data about the world has advanced to an astonishing degree in recent years. However, that ability is far from perfect, and strongly established scientific and philosophical principles tell us that it is impossible to definitively measure human outcomes from underlying data in physical or computing systems; and that it is impossible to create algorithmic rules that exactly predict them.

Sometimes automated systems succeed despite these limitations – anti-lock braking technology has become nearly ubiquitous because it is more effective than most human drivers at slowing down cars in a controlled way. But in other cases they create such great uncertainties that we must build in safeguards to account for the very real possibility that insights drawn from data are wrong. I do this every time I leave my home with a small umbrella packed in my bag despite the fact that weather forecasts created using enormous amounts of computing power predict a sunny day.

(No matter how sophisticated computer models of cities become, there are fundamental reasons why they will always be simplifications of reality. It is only by understanding those constraints that we can understand which insights from computer models are valuable, and which may be misleading. Image of Sim City by haljackey)

We can only understand where an “algorithmic” approach can be trusted; where it needs safeguards; and where it is wholly inadequate by understanding these limitations. Some of them are practical, and limited only by the sensitivity of today’s sensors and the power of today’s computers. But others are fundamental laws of physics and limitations of logical systems.

When technology companies assert that Smart Cities can create “autonomous, intelligently functioning IT systems that will have perfect knowledge of users’ habits” (as London School of Economics Professor Adam Greenfield rightly criticised in his book “Against the Smart City”), they are ignoring these challenges.

A blog published by the highly influential magazine Wired recently made similar overstatements: “The Universe is Programmable” argues that we should extend the concept of an “Application Programming Interface (API)” – a facility usually offered by technology systems to allow external computer programmes to control or interact with them – to every aspect of the world, including our own biology.

To compare complex, unpredictable, emergent biological and social systems to the very logical, deterministic world of computer software is at best a dramatic oversimplification. The systems that comprise the human body range from the armies of symbiotic microbes that help us digest food in our stomachs to the consequences of using corn syrup to sweeten food to the cultural pressure associated with “size 0” celebrities. Many of those systems can’t be well modelled in their own right, let alone deterministically related to each other; let alone formally represented in an accurate, detailed way by technology systems (or even in mathematics).

We should regret and avoid the hubris that leads to the distrust of technology by overstating its capability and failing to recognise its challenges and limitations. That distrust is a barrier that prevents us from achieving the very real benefits that data and technology can bring, and that have been convincingly demonstrated in the past.

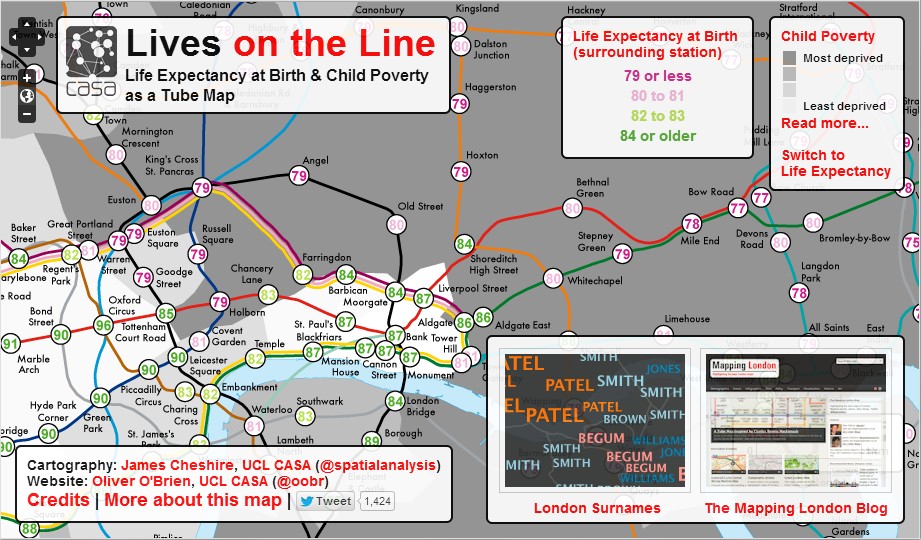
For example, an enormous contribution to our knowledge of how to treat and prevent disease was made by John Snow who used data to analyse outbreaks of cholera in London in the 19th century. Snow used a map to correlate cases of cholera to the location of communal water pipes, leading to the insight that water-borne germs were responsible for spreading the disease. We wash our hands to prevent diseases spreading through germs in part because of what we would now call the “geospatial data analysis” performed by John Snow.

Many of the insights that we seek from analytic and smart city systems are human in nature, not physical or mathematical – for example identifying when and where to apply social care interventions in order to reduce the occurrence of  emotional domestic abuse. Such questions are complex and uncertain: what is “emotional domestic abuse?” Is it abuse inflicted by a live-in boyfriend, or by an estranged husband who lives separately but makes threatening telephone calls? Does it consist of physical violence or bullying? And what is “bullying”?

IMG_0209-1

(John Snow’s map of cholera outbreaks in 19th century London)

We attempt to create structured, quantitative data about complex human and social issues by using approximations and categorisations; by tolerating ranges and uncertainties in numeric measurements; by making subjective judgements; and by looking for patterns and clusters across different categories of data. Whilst these techniques can be very powerful, just how difficult it is to be sure what these conventions and interpretations should be is illustrated by the controversies that regularly arise around “who knew what, when?” whenever there is a high profile failure in social care or any other public service.

These challenges are not limited to “high level” social, economic and biological systems. In fact, they extend throughout the worlds of physics and chemistry into the basic nature of matter and the universe. They fundamentally limit the degree to which we can measure the world, and our ability to draw insight from that information.

By being aware of these limitations we are able to design systems and practises to use data and technology effectively. We know more about the weather through modelling it using scientific and mathematical algorithms in computers than we would without those techniques; but we don’t expect those forecasts to be entirely accurate. Similarly, supermarkets can use data about past purchases to make sufficiently accurate predictions about future spending patterns to boost their profits, without needing to predict exactly what each individual customer will buy.

We underestimate the limitations and flaws of these approaches at our peril. Whilst Tim O’Reilly cites several automated financial systems as good examples of “algorithmic regulation”, the financial crash of 2008 showed the terrible consequences of the thoroughly inadequate risk management systems used by the world’s financial institutions compared to the complexity of the system that they sought to profit from. The few institutions that realised that market conditions had changed and that their models for risk management were no longer valid relied instead on the expertise of their staff, and avoided the worst affects. Others continued to rely on models that had started to produce increasingly misleading guidance, leading to the recession that we are only now emerging from six years later, and that has damaged countless lives around the world.

Every day in their work, scientists, engineers and statisticians draw conclusions from data and analytics, but they temper those conclusions with an awareness of their limitations and any uncertainties inherent in them. By taking and communicating such a balanced and informed approach to applying similar techniques in cities, we will create more trust in these technologies than by overstating their capabilities.

What follows is a description of some of the scientific, philosophical and practical issues that lead inevitability to uncertainty in data, and to limitations in our ability to draw conclusions from it:

But I’ll finish with an explanation of why we can still draw great value from data and analytics if we are aware of those issues and take them properly into account.

Three reasons why we can’t measure data perfectly

(How Heisenberg’s Uncertainty Principle results from the dual wave/particle nature of matter. Explanation by HyperPhysics at Georgia State University)

1. Heisenberg’s Uncertainty Principle and the fundamental impossibility of knowing everything about anything

Heisenberg’s Uncertainty Principle is a cornerstone of Quantum Mechanics, which, along with General Relativity, is one of the two most fundamental theories scientists use to understand our world. It defines a limit to the precision with which certain pairs of properties of the basic particles which make up the world – such as protons, neutrons and electrons – can be known at the same time. For instance, the more accurately we measure the position of such particles, the more uncertain their speed and direction of movement become.

The explanation of the Uncertainty Principle is subtle, and lies in the strange fact that very small “particles” such as electrons and neutrons also behave like “waves”; and that “waves” like beams of light also behave like very small “particles” called “photons“. But we can use an analogy to understand it.

In order to measure something, we have to interact with it. In everyday life, we do this by using our eyes to measure lightwaves that are created by lightbulbs or the sun and that then reflect off objects in the world around us.

But when we shine light on an object, what we are actually doing is showering it with billions of photons, and observing the way that they scatter. When the object is quite large – a car, a person, or a football – the photons are so small in comparison that they bounce off without affecting it. But when the object is very small – such as an atom – the photons colliding with it are large enough to knock it out of its original position. In other words, measuring the current position of an object involves a collision which causes it to move in a random way.

This analogy isn’t exact; but it conveys the general idea. (For a full explanation, see the figure and link above). Most of the time, we don’t notice the effects of Heisenberg’s Uncertainty Principle because it applies at extremely small scales. But it is perhaps the most fundamental law that asserts that “perfect knowledge” is simply impossible; and it illustrates a wider point that any form of measurement or observation in general affects what is measured or observed. Sometimes the effects are negligible,  but often they are not – if we observe workers in a time and motion study, for example, we need to be careful to understand the effect our presence and observations have on their behaviour.

2. Accuracy, precision, noise, uncertainty and error: why measurements are never fully reliable

Outside the world of Quantum Mechanics, there are more practical issues that limit the accuracy of all measurements and data.

(A measurement of the electrical properties of a superconducting device from my PhD thesis. Theoretically, the behaviour should appear as a smooth, wavy line; but the experimental measurement is affected by noise and interference that cause the signal to become "fuzzy". In this case, the effects of noise and interference - the degree to which the signal appears "fuzzy" - are relatively small relative to the strength of the signal, and the device is usable)

(A measurement of the electrical properties of a superconducting device from my PhD thesis. Theoretically, the behaviour should appear as a smooth, wavy line; but the experimental measurement is affected by noise and interference that cause the signal to become “fuzzy”. In this case, the effects of noise and interference – the degree to which the signal appears “fuzzy” – are relatively small compared to the strength of the signal, and the device is usable)

We live in a “warm” world – roughly 300 degrees Celsius above what scientists call “absolute zero“, the coldest temperature possible. What we experience as warmth is in fact movement: the atoms from which we and our world are made “jiggle about” – they move randomly. When we touch a hot object and feel pain it is because this movement is too violent to bear – it’s like being pricked by billions of tiny pins.

This random movement creates “noise” in every physical system, like the static we hear in analogue radio stations or on poor quality telephone connections.

We also live in a busy world, and this activity leads to other sources of noise. All electronic equipment creates electrical and magnetic fields that spread beyond the equipment itself, and in turn affect other equipment – we can hear this as a buzzing noise when we leave smartphones near radios.

Generally speaking, all measurements are affected by random noise created by heat, vibrations or electrical interference; are limited by the precision and accuracy of the measuring devices we use; and are affected by inconsistencies and errors that arise because it is always impossible to completely separate the measurement we want to make from all other environmental factors.

Scientists, engineers and statisticians are familiar with these challenges, and use techniques developed over the course of more than a century to determine and describe the degree to which they can trust and rely on the measurements they make. They do not claim “perfect knowledge” of anything; on the contrary, they are diligent in describing the unavoidable uncertainty that is inherent in their work.

3. The limitations of measuring the natural world using digital systems

One of the techniques we’ve adopted over the last half century to overcome the effects of noise and to make information easier to process is to convert “analogue” information about the real world (information that varies smoothly) into digital information – i.e. information that is expressed as sequences of zeros and ones in computer systems.

(When analogue signals are amplified, so is the noise that they contain. Digital signals are interpreted using thresholds: above an upper threshold, the signal means “1”, whilst below a lower threshold, the signal means “0”. A long string of “0”s and “1”s can be used to encode the same information as contained in analogue waves. By making the difference between the thresholds large compared to the level of signal noise, digital signals can be recreated to remove noise. Further explanation and image by Science Aid)

This process involves a trade-off between the accuracy with which analogue information is measured and described, and the length of the string of digits required to do so – and hence the amount of computer storage and processing power needed.

This trade-off can be clearly seen in the difference in quality between an internet video viewed on a smartphone over a 3G connection and one viewed on a high definition television using a cable network. Neither video will be affected by the static noise that affects weak analogue television signals, but the limited bandwidth of a 3G connection dramatically limits the clarity and resolution of the image transmitted.

The Nyquist–Shannon sampling theorem defines this trade-off and the limit to the quality that can be achieved in storing and processing digital information created from analogue sources. It determines the quality of digital data that we are able to create about any real-world system – from weather patterns to the location of moving objects to the fidelity of sound and video recordings. As computers and communications networks continue to grow more powerful, the quality of digital information will improve,  but it will never be a perfect representation of the real world.

Three limits to our ability to analyse data and draw insights from it

1. Gödel’s Incompleteness Theorem and the inconsistency of algorithms

Kurt Gödel’s Incompleteness Theorem sets a limit on what can be achieved by any “closed logical system”. Examples of “closed logical systems” include computer programming languages, any system for creating algorithms – and mathematics itself.

We use “closed logical systems” whenever we create insights and conclusions by combining and extrapolating from basic data and facts. This is how all reporting, calculating, business intelligence, “analytics” and “big data” technologies work.

Gödel’s Incompleteness Theorem proves that any closed logical system can be used to create conclusions that  it is not possible to show are true or false using the same system. In other words, whilst computer systems can produce extremely useful information, we cannot rely on them to prove that that information is completely accurate and valid. We have to do that ourselves.

Gödel’s theorem doesn’t stop computer algorithms that have been verified by humans using the scientific method from working; but it does mean that we can’t rely on computers to both generate algorithms and guarantee their validity.

2. The behaviour of many real-world systems can’t be reduced analytically to simple rules

Many systems in the real-world are complex: they cannot be described by simple rules that predict their behaviour based on measurements of their initial conditions.

A simple example is the “three body problem“. Imagine a sun, a planet and a moon all orbiting each other. The movement of these three objects is governed by the force of gravity, which can be described by relatively simple mathematical equations. However, even with just three objects involved, it is not possible to use these equations to directly predict their long-term behaviour – whether they will continue to orbit each other indefinitely, or will eventually collide with each other, or spin off into the distance.

(A computer simulation by Hawk Express of a Belousov–Zhabotinsky reaction,  in which reactions between liquid chemicals create oscillating patterns of colour. The simulation is carried out using “cellular automata” a technique based on a grid of squares which can take different colours. In each “turn” of the simulation, like a turn in a board game, the colour of each square is changed using simple rules based on the colours of adjacent squares. Such simulations have been used to reproduce a variety of real-world phenomena)

As Stephen Wolfram argued in his controversial book “A New Kind of Science” in 2002, we need to take a different approach to understanding such complex systems. Rather than using mathematics and logic to analyse them, we need to simulate them, often using computers to create models of the elements from which complex systems are composed, and the interactions between them. By running simulations based on a large number of starting points and comparing the results to real-world observations, insights into the behaviour of the real-world system can be derived. This is how weather forecasts are created, for example. 

But as we all know, weather forecasts are not always accurate. Simulations are approximations to real-world systems, and their accuracy is restricted by the degree to which digital data can be used to represent a non-digital world. For this reason, conclusions and predictions drawn from simulations are usually “average” or “probable” outcomes for the system as a whole, not precise predictions of the behaviour of the system or any individual element of it. This is why weather forecasts are often wrong; and why they predict likely levels of rain and windspeed rather than the shape and movement of individual clouds.

(Hello)

(A simple and famous example of a computer programme that never stops running because it calls itself. The output continually varies by printing out characters based on random number generation. Image by Prosthetic Knowledge)

3. Some problems can’t be solved by computing machines

If I consider a simple question such as “how many letters are in the word ‘calculation’?”, I can easily convince myself that a computer programme could be written to answer the question; and that it would find the answer within a relatively short amount of time. But some problems are much harder to solve, or can’t even be solved at all.

For example, a “Wang Tile” (see image below) is a square tile formed from four triangles of different colours. Imagine that you have bought a set of tiles of various colour combinations in order to tile a wall in a kitchen or bathroom. Given the set of tiles that you have bought, is it possible to tile your wall so that triangles of the same colour line up to each other, forming a pattern of “Wang Tile” squares?

In 1966 Robert Berger proved that no algorithm exists that can answer that question. There is no way to solve the problem – or to determine how long it will take to solve the problem – without actually solving it. You just have to try to tile the room and find out the hard way.

One of the most famous examples of this type of problem is the “halting problem” in computer science. Some computer programmes finish executing their commands relatively quickly. Others can run indefinitely if they contain a “loop” instruction that never ends. For others which contain complex sequences of loops and calls from one section of code to another, it may be very hard to tell whether the programme finishes quickly, or takes a long time to complete, or never finishes its execution at all.

Alan Turing, one of the most important figures in the development of computing, proved in 1936 that a general algorithm to determine whether or not any computer programme finishes its execution does not exist. In other words, whilst there are many useful computer programmes in the world, there are also problems that computer programmes simply cannot solve.

(A set of Wang Tiles, and a pattern created by tiling them so that tiles are placed next to other tiles so that their edges have the same colour. Given any particular set of tiles, it is impossible to determine whether such a pattern can be created by any means other than trial and error)

(A set of Wang Tiles, and a pattern of coloured squares created by tiling them. Given any random set of tiles of different colour combinations, there is no set of rules that can be relied on to determine whether a valid pattern of coloured squares can be created from them. Sometimes, you have to find out by trial and error. Images from Wikipedia)

Five reasons why the human world is messy, unpredictable, and can’t be perfectly described using data and logic

1. Our actions create disorder

The 2nd Law of Thermodynamics is a good candidate for the most fundamental law of science. It states that as time progresses, the universe becomes more disorganised. It guarantees that ultimately – in billions of years – the Universe will die as all of the energy and activity within it dissipates.

An everyday practical consequence of this law is that every time we act to create value – building a shed, using a car to get from one place to another, cooking a meal – our actions eventually cause a greater amount of disorder to be created as a consequence – as noise, pollution, waste heat or landfill refuse.

For example, if I spend a day building a shed, then to create that order and value from raw materials, I consume structured food and turn it into sewage. Or if I use an electric forklift to stack a pile of boxes, I use electricity that has been created by burning structured coal into smog and ash.

So it is literally impossible to create a “perfect world”. Whenever we act to make a part of the world more ordered, we create disorder elsewhere. And ultimately – thankfully, long after you and I are dead – disorder is all that will be left.

2. The failure of Logical Atomism: why the human world can’t be perfectly described using data and logic

In the 20th Century two of the most famous and accomplished philosophers in history, Bertrand Russell and Ludwig Wittgenstein, invented “Logical Atomism“, a theory that the entire world could be described by using “atomic facts” – independent and irreducible pieces of knowledge – combined with logic.

But despite 40 years of work, these two supremely intelligent people could not get their theory to work: “Logical Atomism” failed. It is not possible to describe our world in that way.

One cause of the failure was the insurmountable difficulty of identifying truly independent, irreducible atomic facts. “The box is red” and “the circle is blue”, for example, aren’t independent or irreducible facts for many reasons. “Red” and “blue” are two conventions of human language used to describe the perceptions created when electro-magnetic waves of different frequencies arrive at our retinas. In other words, they depend on and relate to each other through a number of sophisticated systems.

Despite centuries of scientific and philosophical effort, we do not have a complete understanding of how to describe our world at its most basic level. As physicists have explored the world at smaller and smaller scales, Quantum Mechanics has emerged as the most fundamental theory for describing it – it is the closest we have come to finding the “irreducible facts” that Russell and Wittgenstein were looking for. But whilst the mathematical equations of Quantum Mechanics predict the outcomes of experiments very well, after nearly a century, physicists still don’t really agree about what those equations mean. And as we have already seen, Heisenberg’s Uncertainty Principle prevents us from ever having perfect knowledge of the world at this level.

Perhaps the most important failure of logical atomism, though, was that it proved impossible to use logical rules to turn “facts” at one level of abstraction – for example, “blood cells carry oxygen”, “nerves conduct electricity”, “muscle fibres contract” – into facts at another level of abstraction – such as “physical assault is a crime”. The human world and the things that we care about can’t be described using logical combinations of “atomic facts”. For example, how would you define the set of all possible uses of a screwdriver, from prising the lids off paint tins to causing a short-circuit by jamming it into a switchboard?

Our world is messy, subjective and opportunistic. It defies universal categorisation and logical analysis.

(A Pescheria in Bari, Puglia, where a fish-market price information service makes it easier for local fisherman to identify the best buyers and prices for their daily catch. Photo by Vito Palmi)

3. The importance and inaccessibility of “local knowledge” 

Because the tool we use for calculating and agreeing value when we exchange goods and services is money, economics is the discipline that is often used to understand the large-scale behaviour of society. We often quantify the “growth” of society using economic measures, for example.

But this approach is notorious for overlooking social and environmental characteristics such as health, happiness and sustainability. Alternatives exist, such as the Social Progress Index, or the measurement framework adopted by the United Nations 2014 Human Development Report on world poverty; but they are still high level and abstract.

Such approaches struggle to explain localised variations, and in particular cannot predict the behaviours or outcomes of individual people with any accuracy. This “local knowledge problem” is caused by the fact that a great deal of the information that determines individual actions is personal and local, and not measurable at a distance – the experienced eye of the fruit buyer assessing not just the quality of the fruit but the quality of the farm and farmers that produce it, as a measure of the likely consistency of supply; the emotional attachments that cause us to favour one brand over another; or the degree of community ties between local businesses that influence their propensity to trade with each other.

Sharing economy” business models that use social media and reputation systems to enable suppliers and consumers of goods and services to find each other and transact online are opening up this local knowledge to some degree. Local food networks, freecycling networks, and land-sharing schemes all use this technology to the benefit of local communities whilst potentially making information about detailed transactions more widely available. And to some degree, the human knowledge that influences how transactions take place can be encoded in “expert systems” which allow computer systems to codify the quantitative and heuristic rules by which people take decisions.

But these technologies are only used in a subset of the interactions that take place between people and businesses across the world, and it is unlikely that they’ll become ubiquitous in the foreseeable future (or that we would want them to become so). Will we ever reach the point where prospective house-buyers delegate decisions about where to live to computer programmes operating in online marketplaces rather than by visiting places and imagining themselves living there? Will we somehow automate the process of testing the freshness of fish by observing the clarity of their eyes and the freshness of their smell before buying them to cook and eat?

In many cases, while technology may play a role introducing potential buyers and sellers of goods and services to each other, it will not replace – or predict – the human behaviours involved in the transaction itself.

(Medway Youth Trust use predictive and textual analytics to draw insight into their work helping vulnerable children. They use technology to inform expert case workers, not to take decisions on their behalf.)

4. “Wicked problems” cannot be described using data and logic

Despite all of the challenges associated with problems in mathematics and the physical sciences, it is nevertheless relatively straightforward to frame and then attempt to solve problems in those domains; and to determine whether the resulting solutions are valid.

As the failure of Logical Atomism showed, though, problems in the human domain are much more difficult to describe in any systematic, complete and precise way – a challenge known as the “frame problem” in artificial intelligence. This is particularly true of “wicked problems” – challenges such as social mobility or vulnerable families that are multi-faceted, and consist of a variety of interdependent issues.

Take job creation, for example. Is that best accomplished through creating employment in taxpayer-funded public sector organisations? Or by allowing private-sector wealth to grow, creating employment through “trickle-down” effects? Or by maximising overall consumer spending power as suggested by “middle-out” economics? All of these ideas are described not using the language of mathematics or other formal logical systems, but using natural human language which is subjective and inconsistent in use.

The failure of Logical Atomism to fully represent such concepts in formal logical systems through which truth and falsehood can be determined with certainty emphasises what we all understand intuitively: there is no single “right” answer to many human problems, and no single “right” action in many human situations.

(An electricity bill containing information provided by OPower comparing one household’s energy usage to their neighbours. Image from Grist)

5. Behavioural economics and the caprice of human behaviour

Behavioural economics” attempts to predict the way that humans behave when taking choices that have a measurable impact on them – for example, whether to put the washing machine on at 5pm when electricity is expensive, or at 11pm when it is cheap.

But predicting human behaviour is notoriously unreliable.

For example, in a smart water-meter project in Dubuque, Iowa, households that were told how their water conservation compared to that of their near neighbours were found to be twice as likely to take action to improve their efficiency as those who were only told the details of their own water use. In other words, people who were given quantified evidence that they were less responsible water user than their neighbours changed their behaviour. OPower have used similar techniques to help US households save 1.9 terawatt hours of power simply by including a report based on data from smart meters in a printed letter sent with customers’ electricity bills.

These are impressive achievements; but they are not always repeatable. A recycling scheme in the UK that adopted a similar approach found instead that it lowered recycling rates across the community: households who learned that they were putting more effort into recycling than their neighbours asked themselves “if my neighbours aren’t contributing to this initiative, then why should I?”

Low carbon engineering technologies like electric vehicles have clearly defined environmental benefits and clearly defined costs. But most Smart Cities solutions are less straightforward. They are complex socio-technical systems whose outcomes are emergent. Our ability to predict their performance and impact will certainly improve as more are deployed and analysed, and as University researchers, politicians, journalists and the public assess them. But we will never predict individual actions using these techniques, only the average statistical behaviour of groups of people. This can be seen from OPower’s own comparison of their predicted energy savings against those actually achieved – the predictions are good, but the actual behaviour of OPower’s customers shows a high degree of apparently random variation. Those variations are the result of the subjective, unpredictable and sometimes irrational behaviour of real people.

We can take insight from Behavioural Economics and other techniques for analysing human behaviour in order to create appropriate strategies, policies and environments that encourage the right outcomes in cities; but none of them can be relied on to give definitive solutions to any individual person or situation. They can inform decision-making, but are always associated with some degree of uncertainty. In some cases, the uncertainty will be so small as to be negligible, and the predictions can be treated as deterministic rules for achieving the desired outcome. But in many cases, the uncertainty will be so great that predictions can only be treated as general indications of what might happen; whilst individual actions and outcomes will vary greatly.

(Of course it is impossible to predict individual criminal actions as portrayed in the film “Minority Report”. But is is very possible to analyse past patterns of criminal activity, compare them to related data such as weather and social events, and predict the likelihood of crimes of certain types occurring in certain areas. Cities such as Memphis and Chicago have used these insights to achieve significant reductions in crime)

Learning to value insight without certainty

Mathematics and digital technology are incredibly powerful; but they will never perfectly and completely describe and predict our world in human terms. In many cases, our focus for using them should not be on automation: it should be on the enablement of human judgement through better availability and communication of information. And in particular, we should concentrate on communicating accurately the meaning of information in the context of its limitations and uncertainties.

There are exceptions where we automate systems because of a combination of a low-level of uncertainty in data and a large advantage in acting autonomously on it. For example, anti-lock braking systems save lives by using automated technology to take thousands of decisions more quickly than most humans would realise that even a single decision needed to be made; and do so based on data with an extremely low degree of uncertainty.

But the most exciting opportunity for us all is to learn to become sophisticated users of information that is uncertain. The results of textual analysis of sentiment towards products and brands expressed in social media are far from certain; but they are still of great value. Similar technology can extract insights from medical research papers, case notes in social care systems, maintenance logs of machinery and many other sources. Those insights will rarely be certain; but properly assessed by people with good judgement they can still be immensely valuable.

This is a much better way to understand the value of technology than ideas like “perfect knowledge” and “algorithmic regulation”. And it is much more likely that people will trust the benefits that we claim new technologies can bring if we are open about their limitations. People won’t use technologies that they don’t trust; and they won’t invest their money in them or vote for politicians who say they’ll spend their taxes on it.

Thankyou to Richard Brown and Adrian McEwen for discussions on Twitter that helped me to prepare this article. A more in-depth discussion of some of the scientific and philosophical issues I’ve described, and an exploration of the nature of human intelligence and its non-deterministic characteristics, can be found in the excellent paper “Answering Descartes: Beyond Turing” by Stuart Kauffman published by MIT press.

Three mistakes we’re still making about Smart Cities

(David Willets, MP, Minister for Universities and Science, launches the UK Government’s Smart Cities Forum)

(I was asked this week to contribute my view of the present state of the Smart Cities movement to the UK Government’s launch of it’s Smart Cities forum, which will report to the Government’s Information Economy Council. This article is based on my remarks at the event).

One measure of how successfully we have built today’s cities using the technologies that shaped them over the last century – concrete, steel and the internal combustion engine – is the variation of life expectancy within them. In the UK, people born in the poorest areas of our large cities can expect to live lives that are two decades shorter than those born in the wealthiest areas.

We need to do much better than that as we apply the next generation of technology that will shape our lives – digital technology.

The market for Smart Cities, which many define as the application of digital technology to city systems, is growing. Entrepreneurial businesses such as Droplet and Shutl are delivering new city services, enabled by technology. City Councils, service providers and transport authorities are investing in Smart infrastructures, such as Bradford’s City Park, whose fountains and lights react to the movements of people through it. Our cities are becoming instrumented, interconnected and intelligent, creating new opportunities to improve the performance and efficiency of city systems.

But we are still making three mistakes that limit the scale at which truly innovative Smart City projects are being deployed.

1. We don’t use the right mix of skills to define Smart City initiatives

Over the last year, I’ve seen a much better understanding develop between some of the creative professions in the Smart Cities domain: technologists, design thinkers, social innovators, entrepreneurs and urban designers. Bristol’s “Hello Lamppost” is a good example of a project that uses technology to encourage playful interaction with an urban environment, thereby bringing the life to city streets that the urbanist Jane Jacobs‘ taught us is so fundamental to healthy city communities.

Internationally, cities have a great opportunity to learn from each others’ successes: smart, collective, sustainable urbanism in Scandinavia, as exemplified by Copenhagen’s Nordhavnen district; intelligent city planning and management in Asia and increasingly in the United States, where cities such as Chicago have also championed the open data movement; and the phenomenal level of small-scale, non-institutional innovation in communities in UK cities.

But this debate does not extend to some important institutions that are also beginning to explore how they can contribute towards the social and environmental wellbeing of cities and communities. Banks and investors, for example, who have the funds to support large-scale initiatives, or the skills to access them; or supermarkets and other retailers who operate across cities, nations and continents; but whose operational and economic footprint in cities is significant, and whose supply chains support or contribute to billions of lives.

It’s important to engage with these institutions in defining Smart City initiatives which not only cut across traditional silos of responsibility and budgets in cities, but also cut across the traditional asset classes and revenue streams that investors understand. A Smart City initiative that is crafted without their involvement will be difficult for them to understand, and they will be unlikely to support it. Instead, we need to craft Smart initiatives with them.

(The masterplan for Copenhagen’s regeneration of Nordhavnen, which was co-created with local residents and communities. Photo by Thomas Angermann)

2. We ask researchers to answer the wrong challenges

University research is a great source of new technologies for creating Smart solutions. But our challenge is rarely the availability of new technology – we have plenty of that already.

The real challenge is that we are not nearly exploiting the full potential of the technology already available to us; and that’s because in many cases we do not have a quantified evidence base for the financial, social, economic and environmental benefits of applying technology in city systems. Without that evidence, it’s hard to create a business case to justify investment.

This is the really valuable contribution that research could make to the Smart Cities market today: quantify the benefits of applying technology in city systems and communities; identify the factors that determine the degree to which those benefits can be realised in specific cities and communities; align the benefits to the financial and operating models of the public and private institutions that operate city services and assets; and provide the detailed data from which clear businesses cases with quantified risks and returns can be constructed.

3. We don’t listen to the quiet voices that matter

It’s my experience that the most powerful innovations that make a difference to real lives and communities occur when “little things” and “big things” work well together.

Challenges such as transport congestion, social mobility, responsible energy usage or small business growth are often extremely specific to local contexts. Successful change in those contexts is usually created when the people, community groups and businesses involved create, or co-create, initiatives to improve them.

But often, the resources available locally to those communities are very limited. How can the larger resources of institutional organisations be made available to them?

In “Resilience: why things bounce back“, Andrew Zolli describes many examples of initiatives that have successfully created meaningful change; and characterises the unusual qualities of the “translational leaders” that drive them – people who can engage with both small-scale, informal innovation in communities and large-scale, formal institutions with resources.

It’s my hope that we can enable more widespread changes not by relying only on such rare individuals, but by changing the way that we think about the design of city infrastructures. Rather than designing the services that they deliver, we should design what Service Scientists call the “affordances” they offer. An affordance is a capability of an infrastructure that can be adapted to the needs of an individual.

An example might be a smart grid power infrastructure that provides an open API allowing access to data from the grid. Developers, working together with community groups, could create schemes specific to each community which use that information to encourage more responsible energy usage. My colleagues in IBM Research explored this approach in partnership with the Sustainable Dubuque partnership resulting in a scheme that improved water and energy conservation in the city.

We can also apply this approach to the way that food is supplied to cities. The growing and distribution of food will always be primarily a large-scale, industrial operation: with 7 billion people living on a planet with limited resources, and with more than half of them living in dense cities, there is no realistic alternative. An important challenge for the food production and distribution industry, and for the technology industry, is to find ways to make those systems more efficient and sustainable.

But we can also act locally to change the way that food is processed, prepared and consumed; and in doing so create social capital and economic opportunity in some of the places that need it most. A good example is “Casserole Club“, which uses social media as the basis of a peer-to-peer model which connects people who are unable to cook for themselves with people who are willing to cook for, and visit, others.

These two movements to improve our food systems in innovative ways currently act separately; what new value could we create by bringing them together?

We’re very poor at communicating effectively between such large-scale and small-scale activities. Their cultures are different; they use different languages, and those involved spend their working lives in systems focussed on very different objectives.

There’s a very simple solution. We need to listen more than we talk.

We all have strong opinions and great ideas. And we’re all very capable of quickly identifying the aspects of someone else’s idea that mean it won’t work. For all of those reasons, we tend to talk more than we listen. That’s a mistake; it prevents us from being open to new ideas, and focussing our attention on how we can help them to succeed.

New conversations

By coincidence, I was asked earlier this year to arrange the agenda for the annual meeting of IBM’s UK chapter of our global Academy of Technology. The Academy represents around 500 of IBM’s technology leaders worldwide; and the UK chapter brings 70 or so of our highest achieving technologists together every year to share insights and experience about the technology trends that are most important to our industry, and to our customers.

(Daden's visualisation of the new Library of Birmingham, created before construction started and used to familiarise staff with the new building they would be working in. Taken from Daden's brochure describing the work more fully).

(Daden’s visualisation of the new Library of Birmingham, created before construction started and used to familiarise staff with the new building they would be working in. Taken from Daden’s brochure describing the work more fully).

This year, I’m bringing them to Innovation Birmingham for two days next week to explore how technology is changing Britain’s second city. We’ll be hearing about Birmingham City Council’s Smart City Strategy and Digital Birmingham‘s plans for digital infrastructure; and from research initiatives such as the University of Birmingham’s Liveable Cities programme; Aston University’s European Bio-Energy Research Institute; and Birmingham City University’s European Platform for Intelligent Cities.

But we’ll also be hearing from local SMEs and entrepreneurs creating innovations in city systems using technology, such as Droplet‘s smartphone payment system; 3D visualisation and analytics experts Daden, who created a simulation of Birmingham’s new Library; and Maverick Television whose innovations in using technology to create social value include the programmes Embarrassing Bodies and How to Look Good Naked. And we’ll hear from a number of social innovators, such as Localise West Midlands, a not-for-profit think-tank which promotes localisation for social, environmental and economic benefit, and Hub Launchpad, a business-accelerator for social enterprise who are building their presence in the city. You can follow our discussions next week on twitter through the hashtag #IBM_TCG.

This is just one of the ways I’m trying to make new connections and start new conversations between stakeholders in cities and professionals with the expertise to help them achieve their goals. I’m also arranging to meet some of the banks, retailers and supply-chain operators who seem to be most focussed on social and environmental sustainability, in order to explore how those objectives might align with the interests of the cities in which they operate. The British Standards Institute is undertaking a similar project to explore the financing of Smart Cities as part of their Smart Cities programme. I’m also looking at the examples set by cities such as Almere whose collaborative approach to urban design, augmented by their use of analytics and technology, is inspirational.

This will not be a quick or easy process; but it will involve exciting conversations between people with passion and expertise. Providing we remember to listen as much as we talk, it’s the right place to start.

Can Smarter City technology measure and improve our quality of life?

(Photo of Golden Gate Bridge, San Francisco, at night by David Yu)

Can information and technology measure and improve the quality of life in cities?

That seems a pretty fundamental question for the Smarter Cities movement to address. There is little point in us expending time and money on the application of technology to city systems unless we can answer it positively. It’s a question that I had the opportunity to explore with technologists and urbanists from around the world last week at the Urban Systems Collaborative meeting in London, on whose blog this article will also appear.

Before thinking about how we might approach such a challenging and complex issue, I’d like to use two examples to support my belief that we will eventually conclude that “yes, information and technology can improve the quality of life in cities.”

The first example, which came to my attention through Colin Harrison, who heads up the Urban Systems Collaborative, concerns public defibrillator devices – equipment that can be used to give an electric shock to the victim of a heart attack to restart their heart. Defibrillators are positioned in many public buildings and spaces. But who knows where they are and how to use them in the event that someone nearby suffers a heart attack?

To answer those questions, many cities now publish open data lists of the locations of publically-accessible Defibrillators. Consequently, SmartPhone apps now exist that can tell you where the nearest one to you is located. As cities begin to integrate these technologies with databases of qualified first-aiders and formal emergency response systems, it becomes more feasible that when someone suffers a heart attack in a public place, a nearby first-aider might be notified of the incidence and of the location of a nearby defibrillator, and be able to respond valuable minutes before the arrival of emergency services. So in this case, information and technology can increase the chancees of heart attack victims recovering.

(Why Smarter Cities matter: "Lives on the Line" by James Cheshire at UCL's Centre for Advanced Spatial Analysis, showing the variation in life expectancy and correlation to child poverty in London. From Cheshire, J. 2012. Lives on the Line: Mapping Life Expectancy Along the London Tube Network. Environment and Planning A. 44 (7). Doi: 10.1068/a45341)

(Why Smarter Cities matter: “Lives on the Line” by James Cheshire at UCL’s Centre for Advanced Spatial Analysis, showing the variation in life expectancy across London. From Cheshire, J. 2012. Lives on the Line: Mapping Life Expectancy Along the London Tube Network. Environment and Planning A. 44 (7). Doi: 10.1068/a45341)

In a more strategic scenario, the Centre for Advanced Spatial Analysis (CASA) at University College London have mapped life expectancy at birth across London. Life expectancy across the city varies from 75 to 96 years, and CASA’s researchers were able to correlate it with a variety of other issues such as child poverty.

Life expectancy varies by 10 or 20 years in many cities in the developed world; analysing its relationship to other economic, demographic, social and spatial information can provide insight into where money should be spent on providing services that address the issues leading to it, and that determine quality of life. The UK Technology Strategy Board cited Glasgow’s focus on this challenge as one of their reasons for investing £24 million in Glasgow’s Future Cities Demonstrator project – life expectancy at birth for male babies in Glasgow varies by 26 years between the poorest and wealthiest areas of the city.

These examples clearly show that in principle urban data and technology can contribute to improving quality of life in cities; but they don’t explain how to do so systematically across the very many aspects of quality of life and city systems, and between the great variety of urban environments and cultures throughout the world. How could we begin to do that?

Deconstructing “quality of life”

We must first think more clearly about what we mean by “quality of life”. There are many needs, values and outcomes that contribute to quality of life and its perception. Maslow’s “Hierarchy of Needs” is a well-researched framework for considering them. We can use this as a tool for considering whether urban data can inform us about, and help us to change, the ability of a city to create quality of life for its inhabitants.

(Maslow’s Hierarchy of Needs, image by Factoryjoe via Wikimedia Commons)

But whilst Maslow’s hierarchy tells us about the various aspects that comprise the overall quality of life, it only tells us about our relationship with them in a very general sense. Our perception of quality of life, and what creates it for us, is highly variable and depends on (at least) some of the following factors:

  • Individual lifestyle preferences
  • Age
  • Culture and ethnicity
  • Social standing
  • Family status
  • Sexuality
  • Gender
  • … and so on.

Any analysis of the relationship between quality of life, urban data and technology must take this variability into account; either by allowing for it in the analytic approach; or by enabling individuals and communities to customise the use of data to their specific needs and context.

Stress and Adaptability

Two qualities of urban systems and life within them that can help us to understand how urban data of different forms might relate to Maslow’s hierarchy of needs and individual perspectives on it are stress and adaptability.

Jurij Paraszczak, IBM’s Director of Research for Smarter Cities, suggested that one way to improve quality of life is to reduce stress. A city with efficient, well integrated services – such as transport; availability of business permits etc. – will likely cause less stress, and offer a higher quality of life, than a city whose services are disjointed and inefficient.

One cause of stress is the need to change. The Physicist Geoffrey West is one of many scientists who has explored the roles of technology and population growth in speeding up city systems; as our world changes more and more quickly, our cities will need to become more agile and adaptable – technologists, town planners and economists all seem to agree on this point.

The architect Kelvin Campbell has explored how urban environments can support adaptability by enabling actors within them to innovate with the resources available to them (streets, buildings, spaces, technology) in response to changes in local and global context – changes in the economy of cultural trends, for example.

Service scientists” analyse the adaptability of systems (such as cities) by considering the “affordances” they offer to actors within them. An “affordance” is a capability within a system that is not exercised until an actor chooses to exercise it in order to create value that is specific to them, and specific to the time, place and context within which they act.

An “affordance” might be the ability to start a temporary business or “pop-up” shop within a disused building by exploiting a temporary exemption from planning controls. Or it might be the ability to access open city data and use it as the basis of new information-based business services. (I explored some ideas from science, technology, economics and urbanism for creating adaptability in cities in an article in March this year).

(Photo by lecercle of a girl in Mumbai doing her homework on whatever flat surface she could find. Her use of a stationary tool usually employed for physical mobility to enhance her own social mobility is an example of the very basic capacity we all have to use the resources available to us in innovative ways)

Stress and adaptability are linked. The more personal effort that city residents must exert in order to adapt to changing circumstances (i.e. the less that a city offers them useful affordances), then the more stress they will be subjected to.

Stress; rates of change; levels of effort and cost exerted on various activities: these are all things that can be measured.

Urban data and quality of life in the district high street

In order to explore these ideas in more depth, our discussion at the Urban Systems Collaborative meeting explored a specific scenario systematically. We considered a number of candidate scenarios – from a vast city such as New York, with a vibrant economy but affected by issues such as flood risk; through urban parks and property developments down to the scale of an individual building such as a school or hospital.

We chose to start with a scenario in the middle of that scale range that is the subject of particularly intense debate in economics, policy and urban design: a mixed-demographic city district with a retail centre at its heart spatially, socially and economically.

We imagined a district with a population of around 50,000 to 100,000 people within a larger urban area; with an economy including the retail, service and manufacturing sectors. The retail centre is surviving with some new businesses starting; but also with some vacant property; and with a mixture of national chains, independent specialist stores, pawnshops, cafes, payday lenders, pubs and betting shops. We imagined that local housing stock would support many levels of wealth from benefits-dependent individuals and families through to millionaire business owners. A district similar to Kings Heath in Birmingham, where I live, and whose retail economy was recently the subject of an article in the Economist magazine.

We asked ourselves what data might be available in such an environment; and how it might offer insight into the elements of Maslow’s hierarchy.

We began by considering the first level of Maslow’s hierarchy, our physiological needs; and in particular the availability of food. Clearly, food is a basic survival need; but the availability of food of different types – and our individual and cultural propensity to consume them – also contributes to wider issues of health and wellbeing.

(York Road, Kings Heath, in the 2009 Kings Heath Festival. Photo by Nick Lockey)

Information about food provision, consumption and processing can also give insights into economic and social issues. For example, the Economist reported in 2011 that since the 2008 financial crash, some jobs lost in professional service industries such as finance in the UK had been replaced by jobs created in independent artisan industries such as food. Evidence of growth in independent businesses in artisan and craft-related sectors in a city area may therefore indicate the early stages of its recovery from economic shock.

Similarly, when a significant wave of immigration from a new cultural or ethnic group takes place in an area, then it tends to result in the creation of new, independent food businesses catering to preferences that aren’t met by existing providers. So a measure of diversity in food supply can be an indicator of economic and social growth.

So by considering a need that Maslow’s hierarchy places at the most basic level, we were able to identify data that describes an urban area’s ability to support that need – for example, the “Enjoy Kings Heath” website provides information about local food businesses; and furthermore, we identified ways that the same data related to needs throughout the other levels of Maslow’s hierarchy.

We next considered how economic flows within and outside an area can indicate not just local levels of economic activity; but also the area’s trading surplus or deficit. Relevant information in principle exists in the form of the accounts and business reports of businesses. Initiatives such as local currencies and loyalty schemes attempt to maximise local synergies by minimising the flow of money out of local economies; and where they exploit technology platforms such as Droplet’s SmartPhone payments service, which operates in London and Birmingham, the money flows within local economies can be measured.

These money flows have effects that go beyond the simple value of assets and property within an area. Peckham high street in London has unusually high levels of money flow in and out of its economy due to a high degree of import / export businesses; and to local residents transferring money to relatives overseas. This flow of money makes business rents in the area disproportionally high  compared to the value of local assets.

Our debate also touched on environmental quality and transport. Data about environmental quality is increasingly available from sensors that measure water and air quality and the performance of sewage systems. These clearly contribute insights that are relevant to public health. Transport data provides perhaps more subtle insights. It can provide insight into economic activity; productivity (traffic jams waste time); environmental impact; and social mobility.

My colleagues in IBM Research have recently used anonymised data from GPS sensors in SmartPhones to analyse movement patterns in cities such as Abidjan and Istanbul on behalf of their governments and transport authorities; and to compare those movement patterns with public transport services such as bus routes. When such data is used to alter public transport services so that they better match the end-to-end journey requirements of citizens, an enormous range of individual, social, environmental and economic benefits are realised.

(The origins and destinations of end-to-end journeys made in Abidjan, identified from anonymised SmartPhone GPS data)

(The origins and destinations of end-to-end journeys made in Abidjan, identified from anonymised SmartPhone GPS data)

Finally, we considered data sources and aspects of quality of life relating to what Maslow called “self-actualisation”: the ability of people within the urban environment of our scenario to create lifestyles and careers that are individually fulfilling and that reward creative self-expression. Whilst not direct, measurements of the registration of patents, or of the formation and survival of businesses in sectors such as construction, technology, arts and artisan crafts, relate to those values in some way.

In summary, the exercise showed that a great variety of data is available that relates to the ability of an urban environment to provide Maslow’s hierarchy of needs to people within it. To gain a fuller picture, of course, we would need to repeat the exercise with many other urban contexts at every scale from a single building up to the national, international and geographic context within which the city exists. But this seems a positive start.

Recognising the challenge

Of course, it is far from straightforward to convert these basic ideas and observations into usable techniques for deriving insight and value concerning quality of life from urban data.

What about the things that are extremely hard to measure but which are often vital to quality of life – for example the cash economy? Physical cash is notoriously hard to trace and monitor; and arguably it is particularly important to the lives of many individuals and communities who have the most significant quality of life challenges; and to those who are responsible for some of the activities that detract from quality of life – burglary, mugging and the supply of narcotics, for example.

The Urban Systems Collaborative’s debate also touched briefly on the question of whether we can more directly measure the outcomes that people care about – happiness, prosperity, the ability to provide for our families, for example. Antti Poikola has written an article on his blog, “Vital signs for measuring the quality of life in cities“, based on the presentation on that topic by Samir Menon of Tata Consulting Services. Samir identified a number of “happiness indices” that have been proposed by the UK Prime Minister, David Cameron, the European Quality of Life Survey, the OECD’s Better Life Index, and the Social Progress Index created by economist Michael Porter. Those indices generally attempt to correlate a number of different quantitative indicators with qualitative information from surveys into an overall score. Their accuracy and usefulness is the subject of contentious debate.

As an alternative, Michael Mezey of the Royal Society for the Arts recently collected descriptions of attempts to measure happiness more directly by identifying the location of issues or events associated with positive or negative emotions – such as parks and pavements fouled by dog litter or displays of emotion in public. It’s fair to say that the results of these approaches are very subjective and selective so far, but it will be interesting to observe what progress is made.

There is also a need to balance our efforts between creating value from the data that is available to us – which is surely a resource that we should exploit – with making sure that we focus our efforts on addressing our most important challenges, whether or not data relevant to them is easily accessible.

And in practise, a great deal of the data that describes cities is still not very accessible or useful. Most of it exists within IT systems that were designed for a specific purpose – for example, to allow building owners to manage the maintenance of their property. Those systems may not be very good at providing data in a way that is useful for new purposes – for example, identifying whether a door is connected to a pavement by a ramp or by steps, and hence how easy it is for a wheelchair user to enter a building.

(Photo by Closed 24/7 of the Jaguar XF whose designers used “big data” analytics to optimise the emotional response of potential customers and drivers)

Generally speaking, transforming data that is useful for a specific purpose into data that is generally useful takes time, effort and expertise – and costs money. We may desire city data to be tidied up and made more readily accessible; just as we may desire a disused factory to be converted into useful premises for shops and small businesses. But securing the investment required to do so is often difficult – this is why open city data is a “brownfield regeneration” challenge for the information age.

We don’t yet have a general model for addressing that challenge, because the socio-economic model for urban data has not been defined. Who owns it? What does it cost to create? What uses of it are acceptable? When is it proper to profit from data?

Whilst in principle the data available to us, and our ability to derive insight and knowledge from it, will continue to grow, our ability to benefit from it in practise will be determined by these crucial ethical, legal and economic issues.

There are also more technical challenges. As any mathematician or scientist in a numerate discipline knows, data, information and analysis models have significant limitations.

Any measurement has an inherent uncertainty. Location information derived from Smartphones is usually accurate to within a few meters when GPS services are available, for example; but only to within a few hundred meters when derived by triangulation between mobile transmission masts. That level of inaccuracy is tolerable if you want to know which city you are in; but not if you need to know where the nearest defibrilator is.

These limitations arise both from the practical limitations of measurement technology; and from fundamental scientific principles that determine the performance of measurement techniques.

We live in a “warm” world – roughly 300 degrees Celsius above what scientists call “absolute zero“, the coldest temperature possible. Warmth is created by heat energy; that energy makes the atoms from which we and our world are made “jiggle about” – to move randomly. When we touch a hot object and feel pain it is because this movement is too violent to bear – it’s like being pricked by billions of tiny pins. This random movement creates “noise” in every physical system, like the static we hear in analogue radio stations or on poor quality telephone lines.

And if we attempt to measure the movements of the individual atoms that make up that noise, we enter the strange world of quantum mechanics in which Heisenberg’s Uncertainty Principle states that the act of measuring such small objects changes them in unpredictable ways. It’s hardly a precise analogy, but imagine trying to measure how hard the surface of a jelly is by hitting it with a hammer. You’d get an idea of the jelly’s hardness by doing so, but after the act of “measurement” you wouldn’t be left with the same jelly. And before the measurement you wouldn’t be able to predict the shape of the jelly afterwards.

(A graph from my PhD thesis showing experimental data plotted against the predictions of an analytic. Notice that whilst the theoretical prediction (the smooth line) is a good guide to the experimental data, that each actual data point lies above or below the line, not on it. In addition, each data point has a vertical bar expressing the level of uncertainty involved in its measurement. In most circumstances, data is uncertain and theory is only a rough guide to reality.)

Even if our measurements were perfect, our ability to understand what they are telling us is not. We draw insight into the behaviour of a real system by comparing measurements of it to a theoretical model of its behaviour. Weather forecasters predict the weather by comparing real data about temperature, air pressure, humidity and rainfall to sophisticated models of weather systems; but, as the famous British preoccupation with talking about the weather illustrates, their predictions are frequently inaccurate. Quite simply this is because the weather system of our world is more complicated than the models that weather forecasters are able to describe using mathematics; and process using today’s computers.

This may all seem very academic; and indeed it is – these are subjects that I studied for my PhD in Physics. But all scientists, mathematicians and engineers understand them; and whether our work involves city systems, motor cars, televisions, information technology, medicine or human behaviour, when we work with data, information and analysis technology we are very much aware and respectful of their limitations.

Most real systems are more complicated than the theoretical models that we are able to construct and analyse. That is especially true of any system that includes the behaviour of people – in other words, the vast majority of city systems. Despite the best efforts of psychology, social science and artificial intelligence we still do not have an analytic model of human behaviour.

For open data and Smarter Cities to succeed, we need to openly recognise these challenges. Data and technology can add immense value to city systems – for instance, IBM’s “Deep Thunder” technology creates impressively accurate short-term and short-range predictions of weather-related events such as flash-flooding that have the potential to save lives. But those predictions, and any other result of data-based analysis, have limitations; and are associated with caveats and constraints.

It is only by considering the capabilities and limitations of such techniques together that we can make good decisions about how to use them – for example, whether to trust our lives to the automated analytics and control systems involved in anti-lock braking systems, as the vast majority of us do every time we travel by road; or whether to use data and technology only to provide input into a human process of consideration and decision-making – as takes place in Rio when city agency staff consider Deep Thunder’s predictions alongside other data and use their own experience and that of their colleagues in determining how to respond.

In current discussions of the role of technology in the future of cities, we risk creating a divide between “soft” disciplines that deal with qualitative, subjective matters – social science and the arts for example; and “hard” disciplines that deal with data and technology – such as science, engineering, mathematics.

In the most polarised debates, opinion from “soft” disciplines is that “Smart cities” is a technology-driven approach that does not take human needs and nature into account, and does not recognise the variability and uncertainty inherent in city systems; and opinion from “hard” disciplines is that operational, design and policy decisions in cities are taken without due consideration of data that can be used to inform them and predict their outcomes. As Stephan Shakespeare wrote in the “Shakespeare Review of Public Sector Information“, “To paraphrase the great retailer Sir Terry Leahy, to run an enterprise without data is like driving by night with no headlights. And yet that is what government often does.”

There is no reason why these positions cannot be reconciled. In some domains “soft” and “hard” disciplines regularly collaborate. For example, the interior and auditory design of the Jaguar XF car, first manufactured in 2008, was designed by re-creating the driving experience in a simulator at the University of Warwick, and analysing the emotional response of test subjects using physiological sensors and data. Such techniques are now routinely used in product design. And many individuals have a breadth of knowledge that extends far beyond their core profession into a variety of areas of science and the arts.

But achieving reconciliation between all of the stakeholders involved in the vastly complex domain of cities – including the people who live in them, not just the academics, professionals and politicians who study, design, engineer and govern them – will not happen by default. It will only happen if we have an open and constructive debate about the capabilities and the limitations of data, information and technology; and if we are then able to communicate them in a way that expresses to everyone why Smarter City systems will improve their quality of life.

(“Which way to go?” by Peter Roome)

What’s next?
It’s astonishing and encouraging that we could use a model of individual consciousness to navigate the availability and value of data in the massively collective context of an urban scenario. To continue developing an understanding of the ability of information and technology to contribute to quality of life within cities, we need to expand that approach to explore the other dimensions we identified that affect perceptions of quality of life: culture, age and family status, for example; and within both larger and smaller scales of city context than the “district” scenario that we started with.

And we need to compare that approach to existing research work such as the Liveable Cities research collaboration between UK Universities that is establishing an evidence-based technique for assessing wellbeing; or the IBM Research initiative “SCRIBE” which seeks to define the meaning of and relationships between the many types of data that describe cities.

As a next step, the Urban Systems Collaborative attendees suggested that it would be useful to consider how people in different circumstances in cities use data, information and technology to take decisions:  for example, city leaders, businesspeople, parents, hostel residents, commuters, hospital patients and so forth across the incredible variety of roles that we play in cities. You can find out more about how the Collaborative is taking this agenda forward on their website.

But this is not a debate that belongs only within the academic community or with technologists and scientists. Information and technology are changing the cities, society and economy that we live in and depend on. But that information results from data that in large part is created by all of our actions and activities as individuals, as we carry out our lives in cities, interacting with systems that from a technology perspective are increasingly instrumented, interconnected and intelligent. We are the ultimate stakeholders in the information economy, and we should seek to establish an equitable consensus for how our data is used; and that consensus should include an understanding and acceptance between all parties of both the capabilities and limitations of information and technology.

I’ve written before about the importance of telling stories that illustrate ways in which technology and information can change lives and communities for the better. The Community Lovers’ Guide to Birmingham is a great example of doing this. As cities such as Birmingham, Dublin and Chicago demonstrate what can be achieved by following a Smarter City agenda, I’m hoping that those involved can tell stories that will help other cities across the world to pursue these ideas themselves.

(This article summarises a discussion I chaired this week to explore the relationship between urban data, technology and quality of life at the Urban Systems Collaborative’s London workshop, organised by my ex-colleague, Colin Harrison, previously an IBM Distinguished Engineer responsible for much of our Smarter Cities strategy; and my current colleague, Jurij Paraszczak, Director of Industry Solutions and Smarter Cities for IBM ResearchI’m grateful for the contributions of all of the attendees who took part. The article also appears on the Urban Systems Collaborative’s blog).

A design pattern for a Smarter City: the City Information Partnership

(Delay times at traffic junctions visualised by the Dublinked city information partnership.)

(Delay times at traffic junctions visualised by the Dublinked city information partnership.)

(In “Do we need a Pattern Language for Smarter Cities” I suggested that “design patterns“, a tool for capturing re-usable experience invented by the town-planner Christopher Alexander, might offer a useful way to organise our knowledge of successful approaches to “Smarter Cities”. I’m now writing a set of design patterns to describe ideas that I’ve seen work more than once. The collection is described and indexed in “Design Patterns for Smarter Cities” which can be found from the link in the navigation bar of this blog).  

Design Pattern: City Information Partnership

Summary of the pattern: A collaboration between city institutions, communities, service providers and research institutions to share and exploit city data in a socially and financially sustainable system.

City systems, communities and infrastructures affected:

(This description is based on the elements of Smarter City ecosystems presented in “The new Architecture of Smart Cities“).

  • Goals: Any.
  • People: Citizens; innovators.
  • Ecosystem: All.
  • Soft infrastructures: Innovation forums; networks and community organisations.
  • City systems: Any.
  • Hard infrastructures: Information and communications technology.

Commercial operating model:

City information partnerships are often incorporated as “Special Purpose Vehicles” (SPVs) jointly owned by city institutions such as local authorities; universities; other public sector organisations such as schools, healthcare providers and emergency services; services providers such as transportation authorities and utilities; asset owners and operators such as property developers and facility managers; local employers; and private sector providers such as technology companies.

A shared initial investment in technology infrastructure is often required; and in order to address legal issues such as intellectual property rights and liability agreements.

Long-term financial sustainability is dependent on the generation of commercial revenues by licensing the use of data by commercial operations. In cases where such initiatives have been supported only by public sector or research funding, that funding has eventually been reduced or terminated leading to the stagnation or cessation of the initiative.

Soft infrastructures, hard infrastructures and assets required:

Information partnerships only succeed where they are a component of a co-creative dialogue between individuals and organisations in city institutions such as entrepreneurs, community associations, local authorities and social enterprises.

Institutional support is required to provide the models of legal liability and intellectual property ownership that create a trusted and transparent context for collaborative innovation.

Technologies such as Cloud Computing platforms; information management; security; analytics, reporting; visualisation; and data catalogues are required to manage city information and make it available and useful to end users.

Information partnerships require the participation of organisations which between them own and are prepared to make available a sufficiently broad and rich collection of datasets.

Driving forces:

Information is transforming the world’s economy; it provides new insight to support business model creation and operation; makes new products and services possible; and creates new markets.

At the same time global and local demographic trends mean that the cost-base and resource usage of city systems must change.

Information partnerships expose city information to public, private, social and academic research and innovation to discover, create and operate new models for city services; with the potential for resale elsewhere; leading in turn to economic and social growth.

Benefits:

Community hacktivism can usually be engaged by information partnerships to create useful community “apps” such as local transport information and accessibility advice.

The creation of new information-based businesses creates local employment opportunities, and economic export potential.

Information partnerships can provide information resources for technology education in schools, colleges and universities.

New city services developed as a result of the information partnership may provide lower-carbon alternatives to existing city systems such as transportation.

Implications and risks:

If participating organisations such as local authorities include the requirement to contribute data to the information partnership in procurement criteria, then tendering organisations will include any associated costs in their proposals.

For information partnerships to be sustainable, the operating entity needs to be able to accrue and reinvest profits from licenses to exploit data commercially.

The financial returns and economic growth created by information partnerships can take time to develop.

Genuinely constructive partnerships rely on effective engagement between city institutions, businesses and communities.

Existing contracts between local authorities and service providers are unlikely to require that data is contributed to the partnership; and the costs associated with making the data associated with those services available will need to be negotiated.

Alternatives and variations:

Some organisations have provided single-party open data platforms. These can be effective – for example, the APIs offered by e-Bay and Amazon; but individual organisations within cities will rarely have a critical mass of valuable data; or the resources required to operate effective and sustained programmes of engagement with the local community.

Many advocates of open data argue that such data should be freely available. However, the majority of platforms that have made data available freely have struggled to make data available in a form that is usable; to expand the data available; to offer data at a reliable level of service; or to sustain their operations over time. Making good quality data available reliably requires effort, and that effort needs to be paid for.

Examples and stories:

Sources of information:

The UK Open Data Institute is championing open data in the UK – http://www.theodi.org/

O’Reilly Media have published many informative articles on their “Radar” website – http://search.oreilly.com/?q=open+data&x=0&y=0&tmpl=radar

The report “Information Marketplaces: The new economics of cities” published by Arup, The Climate Group, Accenture and Horizon, University of Nottingham – http://www.arup.com/Publications/Information_Marketplaces_the_new_economics_of_cities.aspx

Finally, I have written a series of articles on this blog that explore the benefits and challenges associated with the collaborative exploitation of city information:

Why Open City Data is the Brownfield Regeneration Challenge of the Information Age

(Graphic of New York’s ethnic diversity from Eric Fischer)

I often use this blog to explore ways in which technology can add value to city systems. In this article, I’m going to dig more deeply into my own professional expertise: the engineering of the platforms that make technology reliably available.

Many cities are considering how they can create a city-wide information platform. The potential benefits are considerable: Dublin’s “Dublinked” platform, for example, has stimulated the creation of new high-technology businesses, and is used by scientific researchers to examine ways in which the city’s systems can operate more efficiently and sustainably. And the announcements today by San Francisco that they are legislating to promote open data and have appointed a “Chief Data Officer” for the city are sure to add to the momentum.

But if cities such as Dublin, San Francisco and Chicago have found such platforms so useful, why aren’t there more of them already?

To answer that question, I’d like to start by setting an expectation:

City information platforms are not “new” systems; they are a brownfield regeneration challenge for technology.

Just as urban regenerations need to take account of the existing physical infrastructures such as buildings, transport and utility networks; when thinking about new city technology solutions we need to consider the information infrastructure that is already in place.

A typical city authority has many hundreds of IT systems and applications that store and manage data about their city and region. Private sector organisations who operate services such as buses, trains and power, or who simply own and operate buildings, have similarly large and complex portfolios of applications and data.

So in every city there are thousands – probably tens of thousands – of applications and data sources containing relevant information. (The Dublinked platform was launched in October 2011 with over 3,000 data sets covering the environment, planning, water and transport, for example). Only a very small fraction of those systems will have been designed with the purpose of making information available to and usable by city stakeholders; and they certainly will not have been designed to do so in a joined-up, consistent way.

(A map of the IT systems of a typical organisation, and the interconnections between then)

The picture to the left is a reproduction of a map of the IT systems of a real organisation, and the connections between them. Each block in the diagram represents a major business application that manages data; each line represents a connection between two or more such systems. Some of these individual systems will have involved hundreds of person-years of development over decades of time. Engineering the connections between them will also have involved significant effort and expense.

Whilst most organisations improve the management of their systems over time and sometimes achieve significant simplifications, by and large this picture is typical of the vast majority of organisations today, including those that support the operation of cities.

In the rest of this article, I’ll explore some of the specific challenges for city data and open data that result from this complexity.

My intention is not to argue against bringing city information together and making it available to communities, businesses and researchers. As I’ve frequently argued on this blog, I believe that doing so is a fundamental enabler to transforming the way that cities work to meet the very real social, economic and environmental challenges facing us. But unless we take a realistic, informed approach and undertake the required engineering diligence, we will not be successful in that endeavour.

1. Which data is useful?

Amongst those thousands of data sets that contain information about cities, on which should we concentrate the effort required to make them widely available and usable?

That’s a very hard question to answer. We are seeking innovative change in city systems, which by definition is unpredictable.

One answer is to look at what’s worked elsewhere. For example, wherever information about transport has been made open, applications have sprung up to make that information available to travellers and other transport users in useful ways. In fact most information that describes the urban environment is likely to quickly prove useful; including maps, land use characterisation, planning applications, and the locations of shops, parks, public toilets and other facilities .

The other datasets that will prove useful are less predictable; but there’s a very simple way to discover them: ask. Ask local entrepreneurs what information they need to start new businesses. Ask existing businesses what information about the city would help them be more successful. Ask citizens and communities.

This is the approach we have followed in Sunderland, and more recently in Birmingham through the Smart City Commission and the recent “Smart Hack” weekend. The Dublinked information partnership in Dublin also engages in consultation with city communities and stakeholders to prioritise the datasets that are made available through the platform. The Knight Foundation’s “Information Needs of Communities” report is an excellent explanation of the importance of taking this approach.

2. What data is available?

How do we know what information is contained in those hundreds or thousands of data sets? Many individual organisations find it difficult to “know what they know”; across an entire city the challenge is much harder.

Arguably, that challenge is greatest for local authorities: whilst every organisation is different, as a rule of thumb private sector companies tend to need tens to low hundreds of business systems to manage their customers, suppliers, products, services and operations. Local authorities, obliged by law to deliver hundreds or even thousands of individual services, usually operate systems numbering in the high hundreds or low thousands. The process of discovering, cataloguing and characterising information systems is time-consuming and hence potentially expensive.

The key to resolving the dilemma is an open catalogue which allows this information to be crowdsourced. Anyone who knows of or discovers a data source that is available, or that could be made available, and whose existence and contents are not sensitive, can document it. Correspondingly, anyone who has a need for data that they cannot find or use can document that too. Over time, a picture of the information that describes a city, including what data is available and what is not, will build up. It will not be a complete picture – certainly not initially; but this is a practically achievable way to create useful information.

3. What is the data about?

The content of most data stores is organised by a “key” – a code that indicates the subject of each element of data. That “key” might be a person, a location or an organisation. Unfortunately, all of those things are very difficult to identify correctly and in a way that will be universally understood.

For example, do the following pieces of information refer to the same people, places and organisations?

“Mr. John Jones, Davis and Smith Delicatessen, Harbourne, Birmingham”
“J A Jones, Davies and Smythe, Harborne, B17”
“The Manager, David and Smith Caterers, Birmingham B17”
“Mr. John A and Mrs Jane Elizabeth Jones, 14 Woodhill Crescent, Northfield, Birmingham”

This information is typical of what might be stored in a set of IT systems managing such city information as business rates, citizen information, and supplier details. As human beings we can guess that a Mr. John A Jones lives in Northfield with his wife Mrs. Jane Elizabeth Jones; and that he is the manager of a delicatessen called “Davis and Smith” in Harborne which offers catering services. But to derive that information we have had to interpret several different ways of writing the names of people and businesses; tolerate mistakes in spelling; and tolerate different semantic interpretations of the same entity (is “Davis and Smith” a “Delicatessen” or a “Caterer”? The answer depends on who is asking the question).

(Two views of Exhibition Road in London, which can be freely used by pedestrians, for driving and for parking; the top photograph is by Dave Patten. How should this area be classified? As a road, a car park, a bus-stop, a pavement, a park – or something else? My colleague Gary looks confused by the question in the bottom photograph!)

All of these challenges occur throughout the information stored in IT systems. Some technologies – such as “single view” – exist that are very good at matching the different formats of names, locations and other common pieces of information. In other cases, information that is stored in “codes” – such as “LHR” for “London Heathrow” and “BHX” for “Birmingham International Airport” can be decoded using a glossary or reference data.

Translating semantic meanings is more difficult. For example, is the A45 from Birmingham to Coventry a road that is useful for travelling between the two cities? Or a barrier that makes it difficult to walk from homes on one side of the road to shops on the other? In time semantic models of cities will develop to systematically reconcile such questions, but until they do, human intelligence and interpretation will be required.

4. Sometimes you don’t want to know what the data is about

Sometimes, as soon as you know what something is about, you need to forget that you know. I led a project last year that applied analytic technology to derive new insights from healthcare data. Such data is most useful when information from a variety of sources that relate to the same patient is aggregated together; to do that, the sort of matching I’ve just described is needed. But patient data is sensitive, of course; and in such scenarios patients’ identities should not be apparent to those using the data.

Techniques such as anonymisation and aggregation can be applied to address this requirement; but they need to be applied carefully in order to retain the value of data whilst ensuring that identities and other sensitive information are not inadvertently exposed.

For example, the following information contains an anonymised name and very little address information; but should still be enough for you to determine the identity of the subject:

Subject: 00764
Name: XY67 HHJK6UB
Address: SW1A
Profession: Leader of a political party

(Please submit your answers to me at @dr_rick on Twitter!)

This is a contrived example, but the risk is very real. I live on a road with about 100 houses. I know of one profession to which only two people who live on the road belong. One is a man and one is a woman. It would be very easy for me to identify them based on data which is “anonymised” naively. These issues become very, very serious when you consider that within the datasets we are considering there will be information that can reveal the home address of people who are now living separately from previously abusive partners, for example.

5. Data can be difficult to use

(How the OECD identified the “Top 250 ICT companies” in 2006)

There are many, many reasons why data can be difficult to use. Data contained within a table within a formatted report document is not much use to a programmer. A description of the location of a disabled toilet in a shop can only be used by someone who understands the language it is written in. Even clearly presented numerical values may be associated with complex caveats and conditions or expressed in quantities specific to particular domains of expertise.

For example, the following quote from a 2006 report on the global technology industry is only partly explained by the text box shown in the image on the left:

“In 2005, the top 250 ICT firms had total revenues of USD 3 000 billion”.

(Source: “Information Technology Outlook 2006“, OECD)

Technology can address some of these issues: it can extract information from written reports; transform information between formats; create structured information from written text; and even, to a degree, perform automatic translation between languages. But doing all of that requires effort; and in some cases human expertise will always be required.

In order for city information platforms to be truly useful to city communities, then some thought also needs to be given for how those communities will be offered support to understand and use that information.

6. Can I trust the data?

Several British banks have recently been fined hundreds of millions of dollars for falsely reporting the interest rates at which they are able to borrow money. This information, the “London InterBank Offered Rate” (LIBOR) is an example of open data. The Banks who have been fined were found to have under-reported the interest rate at which they were able to borrow – this made them appear more creditworthy than they actually were.

Such deliberate manipulation is just one of the many reasons we may have to doubt information. Who creates information? How qualified are they to provide accurate information? Who assesses that qualification and tests the accuracy of the information?

For example, every sensor which measures physical information incorporates some element of uncertainty and error. Location information derived from Smartphones is usually accurate to within a few meters when derived from GPS data; but only a few hundred meters when derived by triangulation between mobile transmission masts. That level of inaccuracy is tolerable if you want to know which city you are in; but not if you need to know where the nearest cashpoint is. (Taken to its extreme, this argument has its roots in “Noise Theory“, the behaviour of stochastic processes and ultimately Heisenberg’s Uncertainty Principle in Quantum Mechanics. Sometimes it’s useful to be a Physicist!).

Information also goes out of date very quickly. If roadworks are started at a busy intersection, how does that affect the route-calculation services that many of us depend on to identify the quickest way to get from one place to another? When such roadworks make bus stops inaccessible so that temporary stops are erected in their place, how is that information captured? In fact, this information is often not captured; and as a result, many city transport authorities do not know where all of their bus stops are currently located.

I have barely touched in this section on an enormously rich and complex subject. Suffice to say that determining the “trustability” of information in the broadest sense is an immense challenge.

7. Data is easy to lose

(A computer information failure in Las Vegas photographed by Dave Herholz)

Whenever you find that an office, hotel room, hospital appointment or seat on a train that you’ve reserved is double-booked you’ve experienced lost data. Someone made a reservation for you in a computer system; that data was lost; and so the same reservation was made available to someone else.

Some of the world’s most sophisticated and well-managed information systems lose data on occasion. That’s why we’re all familiar with it happening to us.

If cities are to offer information platforms that local people, communities and businesses come to depend on, then we need to accept that providing reliable information comes at a cost. This is one of the many reasons that I have argued in the past that “open data” is not the same thing as “free data”. If we want to build a profitable business model that relies on the availability of data, then we should expect to pay for the reliable supply of that data.

A Brownfield Regeneration for the Information Age

So if this is all so hard, should we simply give up?

Of course not; I don’t think so, anyway. In this article, I have described some very significant challenges that affect our ability to make city information openly available to those who may be able to use it. But we do not need to overcome all of those challenges at once.

Just as the physical regeneration of a city can be carried out as an evolution in dialogue and partnership with communities, as happened in Vancouver as part of the “Carbon Talks” programme, so can “information regeneration”. Engaging in such a dialogue yields insight into the innovations that are possible now; who will create them; what information and data they need to do so; and what social, environmental and financial value will be created as a result.

That last part is crucial. The financial value that results from such “Smarter City” innovations might not be our primary objective in this context – we are more likely to be concerned with economic, social and environmental outcomes; but it is precisely what is needed to support the financial investment required to overcome the challenges I have discussed in this article.

On a final note, it is obviously the case that I am employed by a company, IBM, which provides products and services that address those challenges. I hope that you have noticed that I have not mentioned a single one of those products or services by name in this article, nor provided any links to them. And whilst IBM are involved in some of the cities that I have mentioned, we are not involved in all of them.

I have written this article as a stakeholder in our cities – I live in one – and as an engineer; not as a salesman. I am absolutely convinced that making city information more widely available and usable is crucial to addressing what Professor Geoffrey West described as “the greatest challenges that the planet has faced since humans became social“. As a professional engineer of information systems I believe that we must be fully cognisant of the work involved in doing so properly; and as a practical optimist, I believe that it is possible to do so in affordable, manageable steps that create real value and the opportunity to change our cities for the better. I hope that I have managed to persuade you to agree.

Four avatars of the metropolis: technologies that will change our cities

(Photo of Chicago by Trey Ratcliff)

Many cities I work with are encouraging clusters of innovative, high-value, technology-based businesses to grow at the heart of their economies. They are looking to their Universities and technology partners to assist those clusters in identifying the emerging sciences and technologies that will disrupt existing industries and provide opportunities to break into new markets.

In advising customers and partners on this subject, I’ve found myself drawn to four themes. Each has the potential to cause significant disruptions, and to create opportunities that innovative businesses can exploit. Each one will also cause enormouse changes in our lives, and in the cities where most of us live and work.

The intelligent web

(Diagram of internet tags associated with “Trafalgar” and their connections relevant to the perception of London by visitors to the city by unclesond)

My colleague and friend Dr Phil Tetlow characterises the world wide web as the biggest socio-technical information-computing space that has ever been created; and he is not alone (I’ve paraphrased his words slightly, but I hope he’ll agree I’ve kept the spirit of them intact).

The sheer size and interconnected complexity of the web is remarkable. At the peak of “web 2.0” in 2007 more new information was created in one year than in the preceding 5000 years. More important, though, are the number and speed of  transactions that are processed through the web as people and automated systems use it to exchange information, and to buy and sell products and services.

Larger-scale emergent phenomena are already resulting from this mass of interactions. They include universal patterns in the networks of links that form between webpages; and the fact that the informal collective activity of “tagging” links on social bookmarking sites tends to result in relatively stable vocabularies that describe the content of the pages that are linked to.

New such phenomena of increasing complexity and significance will emerge as the ability of computers to understand and process information in the forms in which it is used by humans grows; and as that ability is integrated into real-world systems. For example, the IBM “Watson” computer that competed successfully against the human champions of the television quiz show “Jeopardy” is now being used to help healthcare professionals identify candidate diagnoses based on massive volumes of research literature that they don’t have the time to read. Some investment funds now use automated engines to make investment decisions by analysing sentiments expressed on Twitter; and many people believe that self-driving cars will become the norm in the future following the award of a driving license to a Google computer by the State of Nevada.

As these astonishing advances become entwined with the growth in the volume and richness of information on the web, the effects will be profound and unpredictable. The new academic discipline of “Web Science” attempts to understand the emergent phenomena that might arise from a human-computer information processing system of such unprecedented scale. Many believe that our own intelligence emerges from complex information flows within the brain; some researchers in web science are considering the possibility that intelligence in some form might emerge from the web, or from systems like it.

That may seem a leap too far; and for now, it probably is. But as cities such as Birmingham, Sunderland and Dublin pursue the “open data” agenda and make progress towards the ideal of an “urban observatory“, the quantity, scope and richness of the data available on the web concerning city systems will increase many-fold. At the same time, the ability of intelligent agents such as Apple’s “Siri” smartphone technology, and social recommendation (or “decision support”) engines such as FourSquare will evolve too. Indeed, the domain of Smarter Cities is in large part concerned with the application of intelligent analytic software to data from city systems. Between the web of information and analytic technologies that are available now, and the possibilities for emergent artificial intelligence in the future, there lies a rich seam of opportunity for innovative individuals, businesses and communities to exploit the intelligent analysis of city data.

Things that make themselves

(Photo of a structure created by a superparamagnetic fluid containing magnetic nanoparticles in suspension, by Steve Jurvetson)

Can you imagine downloading designs for chocolate, training shoes and toys and then making them in your own home, whenever you like? What if you could do that for prosthetic limbs or even weapons?

3D printing makes all of this possible today. While 3D printers are still complex and expensive, they are rapidly becoming cheaper and easier to use. In time, more and more of us will own and use them. My one-time colleague Ian Hughes has long been an advocate; and Staffordshire University make their 3D printer available to businesses for prototyping and exploratory use.

Their spread will have profound consequences. Gun laws currently control weapons which are relatively large and need to be kept somewhere; and which leave a unique signature on each bullet they fire. But if guns can be “printed” from downloadable designs whenever they are required  – and thrown away afterwards because they are so easy to replace – then forensics will rarely in future have the opportunity to match a bullet to a gun that has been fired before. Enforcement of gun ownership will require the restriction of access to digital descriptions of gun designs. The existing widespread piracy of music and films shows how hard it will be to do that.

3D printers, combined with technologies such as social media, smart materials, nano- and bio-technology and mass customisation, will create dramatic changes in the way that physical products are designed and manufactured – or even grown. For example CocoWorks, a collaboration involving Warwick University, uses a combination of social media and 3D printing to allow groups of friends to collectively design confectionery that they can then “print out” and eat.

These changes will have significant implications for city economies. The reduction in wage differentials between developed and emerging economies already means that in some cases it is more profitable to manufacture locally in rapid response to market demand than to manufacture globally at lowest cost. In the near-future technology advances will accelerate a convergence between the advanced manufacturing, design, communication and information technology industries that means that city economic strategies cannot afford to focus on any of them separately. Instead, they should look for new value at the evolving intersections between them.

Of mice, men and cyborgs

(Professor Kevin Warwick, who in 2002 embedded a silicon chip with 100 spiked electrodes directly into his nervous system. Photo by M1K3Y)

If the previous theme represents the convergence of the information world and products and materials in the physical world; then we should also consider convergence between the information world and living beings.

The “mouse” that defined computer usage from the 1980s through to the 2000s was the first widely successful innovation in human/computer interaction for decades; more recently, the touchscreen has once again made computing devices accessible or acceptable to new communities. I have seen many people who would never choose to use a laptop become inseparable from their iPads; and two-year-old children understand them instinctively. The world will change as these people interact with information in new ways.

More exciting human-computer interfaces are already here – Apple’s intelligent agent for smartphones, “Siri”; Birmingham City University’s MotivPro motion-capture and vibration suit; the Emotiv headset that measures thoughts and can interpret them; and Google’s augmented reality glasses.

Even these innovations have been surpassed by yet more intimate connections between ourselves and the information world. Professor Kevin Warwick at Reading University has pioneered the embedding of technology into the human body (his own body, to be precise) since 2002; and in the effort to create ever-smaller pilotless drone aircraft, control technology has been implanted into insects. There are immense ethical and legal challenges associated with these developments, of course. But it is certain that boundaries will crumble between the information that is processed on a silicon substrate; information that is processed by DNA; and the actions taken by living people and animals.

Historically, growth in Internet coverage and bandwidth and the progress of digitisation technology led to the disintermediation of value chains in industries such as retail, publishing and music. As evolving human/computer interfaces make it possible to digitise new aspects of experience and expression, we will see a continuing impact on the media, communication and information industries. But we will also see unexpected impacts on industries that we have assumed so far to be relatively immune to such disruptions: surgery, construction, waste management, landscape gardening and arbitration are a few that spring to mind as possibilities. (Google futurist Thomas Frey speculated along similar lines in his excellent article “55 Jobs of the Future“).

Early examples are already here, such as Paul Jenning’s work at Warwick University on the engineering of the emotional responses of drivers to the cars they are driving. Looking ahead, there is enormous scope amidst this convergence for the academic, entrepreneurial and technology partners within city ecosystems to collaborate to create valuable new ideas and businesses.

Bartering 2.0

(Photo of the Brixton Pound by Matt Brown)

Civilisation has grown through the specialisation of trades and the diversification of economies. Urbanisation is defined in part by these concepts. They are made possible by the use of money, which provides an abstract quantification of the value of diverse goods and services.

However, we are increasingly questioning whether this quantification is complete and accurate, particularly in accounting for the impact of goods and services on the environments and societies in which they are made and delivered.

Historically, money replaced bartering,  a negotiation of the comparative value of goods and services within an immediate personal context, as the means of quantifying transactions. The abstraction inherent in money dilutes some of the values central to the bartering process. The growing availability of alternatives to traditional bartering and money is making us more conscious of those shortcomings and trade-offs.

Social media, which enables us to make new connections and perform new transactions, combined with new technology-based local currencies and trading systems, offer the opportunity to extend our personalised concepts of value in space and time when negotiating exchanges; and to encourage transactions that improve communities and their environments.

It is by no means clear what effect these grass-roots innovations will have on the vast system of global finance; nor on the social and environmental impact of our activities. But examples are appearing everywhere; from the local, “values-led” banks making an impact in America; to the widespread phenomenon of social enterprise; to the Brixton and Bristol local currencies; and to Droplet, who are aiming to make Birmingham the first city with a mobile currency.

These local currency mechanisms have the ability to support marketplaces trading goods and services such as food, energy, transport, expertise and many of the other commodities vital to the functioning of city economies; and those marketplaces can be designed to promote local social and environmental priorities. They have an ability that we are only just beginning to explore to augment and accelerate existing innovations such as the business-to-consumer and business-to-business markets in sustainable food production operated by Big Barn and Sustaination; or what are so far simply community self-help networks such as Growing Birmingham.

As Smarter City infrastructures expose increasingly powerful and important capabilities to such enterprises – including the “civic hacking” movement – there is great potential for their innovations to contribute in significant ways to the sustainable growth and evolution of cities.

Some things never change

Despite these incredible changes, some things will stay the same. We will still travel to meet in person. We like to interact face-to-face where body language is clear and naturally understood, and where it’s pleasant to share food and drink. And the world will not be wholly equal. Humans are competitive, and human ingenuity will create things that are worth competing for. We will do so, sometimes fairly, sometimes not.

It’s also the case that predictions are usually wrong and futurologists are usually mistaken; so you have good cause to disregard everything you’ve just read.

But whether or not I have the details right, these trends are real, significant, and closer to the mainstream than we might expect. Somewhere in a city near you, entrepreneurs are starting new businesses based on them. Who knows which ones will succeed, and how?

Five roads to a Smarter City

(Photo of Daikoku junction by Ykanazawa1999

Recently, I discussed the ways in which cities are formulating  “Smarter City” visions and the programmes to deliver them. Such cross-city approaches are clearly what’s required in order to have a transformative effect across an entire city.

However, whilst some cities have undergone dramatic changes in this way – or have been built as “Smarter” cities in the first place as in the case of the famous Masdar project in Abu Dhabi – most cities are making progress one step at a time.

Four patterns have emerged in how they are doing so. Each pattern is potentially replicable by other cities; and each represents a proven approach that can be used as part of a wider cross-city plan.

I’ll start at the beginning, though, and describe why cross-city transformations can be hard to envision and deliver. Understanding why that can be the case will give us insight into which simpler, smaller-scale approaches can succeed more easily.

What’s so hard about a Smarter City?

Cities are complex ecosystems of people and organisations which need to work together to create and deliver Smarter City visions. Bringing them together to act in that way is difficult and time-consuming.

(Photo of Beijing by Trey Ratcliff)

Even where a city community has the time and willingness to do that, the fragmented nature of city systems makes it hard to agree a joint approach. Particularly in Europe and the UK, budgets and responsibilities are split between agenices; and services such as utilities and transport are contracted out and subject to performance measures that cannot easily be changed. Agreeing the objectives and priorities for a Smarter City vision in this context is hard enough; agreeing the financing mechanisms to fund programmes to deliver them is even more difficult.

Some of the cities that have made the most progress so far in Smarter City transformations have done so in part because they do not face these challenges – either because they are new-build cities like Masdar, or because they have more hierarchical systems of governance, such as Guangzhou in China. In other cases, critical challenges or unusual opportunities provide the impetus to act – for example in Rio, where an incredible cross-city operations centre has been implemented in preparation for the 2014 World cup and 2016 Olympics.

Elsewhere, cities must spend time and effort building a consensus. San Francisco, Dublin and Sunderland are amongst those who began that process some time ago; and many others are on the way.

But city-wide transformations are not the only approach to changing the way that cities work – they are just one of the five roads to a Smarter City. Four other approaches have been shown to work; and in many cases they are more straightforward as they are contained within individual domains of a city; or exploit changes that are taking place anyway.

Smarter infrastructure

Many cities in the UK and Europe are supported by transport and utility systems whose physical infrastructure is decades old. As urban populations rise and the pace of living increases, these systems are under increasing pressure. “Smarter” concepts and technologies can improve their efficiency and resilience whilst minimising the need to upgrade and expand them physically.

(Photo of a leaking tap by Vinoth Chandar. A project in Dubuque, Iowa showed that a community scheme involving smart meters and shared finances had a significant effect improving the repair of water leaks.)

In South Bend, Indiana, for example, an analytic system helps to predict and prevent wastewater overflows by more intelligently managing the existing infrastructure. The city estimates that they have avoided the need to invest in hundreds of millions of dollars of upgrades to the physical capacity of the infrastructure as a result. In Stockholm, a road-use charging system has significantly reduced congestion and improved environmental quality. In both cases, the systems have direct financial benefits that can be used to justify their cost.

These are just two examples of initiatives that offer a simplified approach to Smarter Cities; they deliver city-wide benefits but their implementation is within the sphere of a single organisation’s responsibility and finances.

Smarter micro-cities 

Environments such as sports stadiums, University campuses, business parks, ports and airports, shopping malls or retirement communities are cities in microcosm. Within them, operational authority and budgetary control across systems such as safety, transportation and communication usually reside with a single organisation. This can make it more straightforward to invest in a technology platform to provide insight into how those systems are operating together – as the Miami Dolphins have done in their Sun Life Stadium.

Other examples of such Smarter “micro-Cities” include the iPark industrial estate in Wuxi, China where a Cloud computing platform provides shared support services to small businesses; and the Louvre museum in Paris where “Intelligent Building” technology controls the performance of the environmental systems that protect the museum’s visitors and exhibits.

(Photo of the Louvre exhibition “‘The Golden Antiquity. Innovations and resistance in the 18th century” from the IBM press release for the Louvre project)

Improving the operation of such “micro-cities” can have a significant impact on the  cities and regions in which they are located – they are often major contributors to the economy and environment.

Shared Public Services

Across the world demographic and financial pressures are causing transformative change in public sector. City and regional leaders have said that their organisations are facing unprecedented challenges. In the UK it is estimated that nearly 900,000 public sector jobs will be lost over 5 years – approximately 3% of national employment.

In order to reduce costs whilst minimising impact to frontline services, many public sector agencies are making arrangements to share the delivery of common administrative services with each other, such as human resources, procurement, finance and customer relationship management.

Often these arrangements are being made locally between organisations that know and trust each other because they have a long history of working together. Sharing services means sharing business applications, IT platforms, and data; as town and village councils did in the Municipal Shared Services Cloud project.

As a result shared IT platforms with co-located information and applications are now deployed in many cities and regions. Smarter City systems depend on access to such information. Sunderland City Council are very aware of this; their CEO and CIO have both spoken about the opportunity for the City Cloud they are deploying to provide information to support public and private-sector innovation. Such platforms are an important enabler for the last trend I’d like to discuss: open data.

Open Data

(A visualisation created by Daniel X O Neil of data from Chicago’s open data portal showing the activities of paid political lobbyists and their customers in the city)

The open data movement lobbies for information from public systems to be made openly available and transparent, in order that citizens and entrepreneurial businesses can find new ways to use it.

In cities such as Chicago (pictured on the left) and Dublin, open data platforms have resulted in the creation of “Apps” that provide useful information and services to citizens; and in the formation of startup companies with new, data-based business models.

There are many challenges and costs involved in providing good quality, usable open data to city communities; but the shared service platforms I’ve described can help to overcome them, and provide the infrastructure for the market-based innovations in city systems that can lead to sustainable economic growth.

Let’s build Smarter Cities … together

All of these approaches can succeed as independent Smarter City initiatives, or as contributions to an overall city-wide plan. The last two in particular seem to be widely applicable. Demographics and economics are driving an inevitable transformation to shared services in public sector; and the open data movement and the phenomenon of “civic hacking” demonstrate the willingness and capability of communities to use technology to create innovations in city systems.

As a result, technology vendors, local authorities and city communities have an exciting opportunity to collaborate. The former have the ability to deliver the robust, scalable, secure infrastructures required to provide and protect information about cities and individual citizens; the latter have the ability to use those platforms to create local innovations in business and service delivery.

At the 3rd EU Summit on Future Internet in Helsinki earlier this year, Juanjo Hierro, Chief Architect for the FI-WARE “future internet platform” project and Chief Technologist for Telefonica,  addressed this topic and identified the specific challenges that civic hackers face that could be addressed by such city information infrastructures; he included real-time access to information from physical city infrastructures; tools for analysing “big data“; and access to technologies to ensure privacy and trust.

Cities such as Sunderland, Birmingham, Dublin, Chicago and San Francisco are amongst those investing in such platforms, and in programmes to engage with communities to stimulate innovation in city systems. Working together, they are taking impressive steps towards making cities smarter.

How cities can exploit the Information Revolution

(This post was first published as part of the “Growth Factory” report from the thinktank TLG Lab).

(Graphic of New York’s ethnic diversity from Eric Fischer)

Cities and regions in the UK face ever-increasing economic, social and environmental challenges. They compete for investment in what is now a single global economy. Demographics are changing with more than 90% of the population now living in urban areas, and where the number of people aged over 65 will double to 19 million by 2050. The resources we consume are becoming more expensive, with cities especially vulnerable to disruptions in supply.

The concept of “Smarter systems” has captured the imagination of experts as an approach to turn these challenges into opportunities for more sustainable economic and social growth; particularly in cities, where most of us live and work. Smarter systems – in cities, transportation, government and industry –can analyse the vast amounts of data being generated around us to help make more informed decisions, operate more efficiently or even predict the future.

These systems enable city planners around the world to design urban environments that promote safety, community vitality and economic growth. They can bring real-time information together from city transportation, social media, emergency services and leisure facilities to better enable cities, such as Rio de Janeiro, to manage major public events. They can enable transport systems to better manage traffic flow and reduce congestion, as in Singapore. They can stimulate economic growth by enabling small businesses to better compete for business in collaboration with regional trading partners, in systems such as that operated by the University of Warwick.

Government policies such as Open Data, personal care budgets and open public services will dramatically increase the information available to citizens to help them take well-informed decisions. This information will be rich, complex and associated with caveats and conditions. Making it usable by the broad population is an immense challenge which will not be addressed by technology alone. Data needs not only to be made available, but understandable so that it can inform better decision-making.

Where does Smarter city data come from?

Raw data for Smarter systems is derived from three sources: the city’s inhabitants, existing IT systems and readings from the physical environment.

Information from people has become more accessible with the continued spread of connected mobile devices, such as smartphones. Open Street Map, for example, provides a global mapping information service sourced from the activities of volunteers with portable satellite navigation devices. However, the quality and availability of crowd-sourced information depends on the availability and resources of volunteers, who cannot be held accountable for whether information is accurate, complete or up-to-date.

It is also important to understand data ownership and the associated privacy concerns. There is a difference between data freely and knowingly contributed by an individual for a specific purpose and information created as a side-effect of their activity – for example, the record of a person’s movements created by the GPS sensor in their smartphone.

The Open Data movement, supported by central government, will dramatically increase the availability of data from public systems. For example, efforts are underway to make NHS healthcare data available, with appropriate security measures, to Life Sciences organisations to reinforce the UK’s pre-eminent position in drug discovery research. However, the infrastructure required to make large volumes of data widely and rapidly available in a usable form will not be created for free. Until their cost is included in future government procurements – or until commercial systems of funding are created – then much data will likely only be made open on a more limited “best efforts” basis.

Furthermore, not all city data is held by public bodies. Many transportation and utility systems are owned and operated by the private sector, and it is not generally established what information they should make available, and how. Many Smarter city systems that use data from such sources are private partnerships rather than open systems.

Meanwhile, certain kinds of data are becoming far more accessible through the advancing ability of computer systems to understand human language. IBM’s Watson computer demonstrated this recently by competing and winning against world champions in the American television quiz show, Jeopardy! Wellpoint is using this kind of technology to draw insight from medical information held in similar forms. Its aim is to better tackle diseases such as cancer by empowering physicians to rapidly evaluate potential diagnoses and explore the latest supporting medical evidence. Similar technology can draw insight from case notes in social care systems, as Medway Youth Trust is doing, or from the reports of engineers maintaining roads, sewers, and other city systems.

An early “mashup” application using open data from Chicago’s police force

Information is also becoming more readily available from the physical environment. In Galway Bay, a network of underwater microphones is connected to a system that can identify and locate the sounds of dolphins and porpoises. Their location provides a dynamic indication of which parts of the Bay have the cleanest water. That information is made available to companies in the Bay to allow them to control their discharges of water; and to the fishing and leisure industries who are dependent on marine life. This Open Data approach is being used by cities across the world such as Dublin, Chicago and London as a resource for citizens and businesses.

Whilst advances in technology have lowered the cost of generating information from physical environments, challenges remain. From the perspective of a mobile telephone user, much of the UK has signal coverage. However, telephones are used one metre or more above ground level; at ground level, where many parts of our transport and utility infrastructures are located, coverage is much poorer. Additionally, mobile transmitters and receivers are relatively expensive and power-hungry. Cheaper, lower power technologies are needed to improve coverage, such as the “Weightless” standard being developed to use transmission bandwidth no-longer needed by analogue television.

Using and combining data appropriately

In order to make information from multiple sources available appropriately and usefully, several issues need to be tackled.

When computer systems are used to analyse information and take decisions, then the data formats and protocols used by those systems need to be matched. Information as simple as locations and dates may need to be converted between formats. At an engineering level, the protocols used to transmit data across cities using wired or wireless communications behave differently and require systems that integrate them.

The meaning of information from related sources also needs to be understood and adapted to context. Citizens who go shopping in wheelchairs need to know how to get between car-parks and shops with lifts, accessible public toilets and cash points. However, the computer systems of the organisations who own those facilities will encode the information separately, in ways that support their efficient management, not that support journey-planning between them.

The City of Portland in Oregon has gone further in a project to understand how information from systems across the city is related. They are now able to better predict the impact that key decisions will have on the entire city, years in advance.

Privacy and ownership of data may affect its subsequent use, often with terms and conditions in place for governing its access. Furthermore, safeguards are required to ensure that sensitive information cannot be inferred from a combination of sources. For example the location of a safe house or shelter being identified from building usage, building ownership and /or information concerning taxi journeys by the employees of particular council agencies.

The human dimension

Smarter systems will only succeed in improving cities if there is wide consumer engagement. To be of value, information will likely need to be timely and presented in a manner appropriate to consumer context. Individual behaviour will only change where personal value is derived as a result of new information being presented – a saving in time or money, or access to something of value to their family.

(Photo of traffic in Dhaka, Bangladesh, from Joisey Showa)

Many cities are experimenting with technologies that predict the future build up of traffic, by comparing real-time measurements to databases of past patterns of traffic flow. In Stockholm, this information is used by a road-use charging system that supports variable pricing. In California, commuters in a pilot project were given personalised predictions of their commuting time each day. Both systems encourage individuals to make choices based on new information.

Utility providers are exploring how information from smart meters can encourage water and energy users to change behaviour. A recent study in Dubuque, Iowa, showed that when householders were shown how their water usage compared to the average for their neighbours, they became better at conserving water – by fixing leaks, or using domestic appliances more efficiently. Skills across artistic and engineering disciplines are helping us understand how this type of information can be communicated more effectively. Many people will not want to study figures and charts on a smart meter or website; instead “ambient” information sources may be more effective – such as a glow-globe that changes colour from green to orange to red depending on household electricity use.

Systems that improve the sustainability of cities could also affect economic development. Lowering congestion through Smarter transportation schemes can improve productivity by reducing time lost by workers delayed by traffic. By making information and educational resources widely available, Smarter systems could improve access to opportunity across city communities. A city with vibrant communities of well-informed citizens may appear a more forward-looking and attractive place to live for educated professionals and, in turn, for businesses considering relocation. New York has improved its attractiveness since the 1970s by lowering the fear of crime. One of its tools is a “real-time crime centre” that brings information together from across the city in order to better react to crime and public order incidents. The system can even help to prevent crime by intelligently deploying police resources to the areas most likely to experience incidents based on past patterns of activity – on days with similar weather, transportation conditions or public events.

Success in delivering against these broader objectives is much more likely to be achieved where the cities themselves are more clearly accountable for them.

So where do we start?

Investments in Smarter systems often cut across organisations and budgets and many have objectives that are macro-economic, social and environmental, as well as financial. As such, they challenge existing accounting mechanisms. Whilst central government and the financial markets offer new investment solutions such as ethical funds, social impact bonds and city deals, so far these have not been used to fund the majority of Smarter solutions – many of which are supported by research programmes. The Technology Strategy Board’s investment in areas such as “Future Cities” and the “Connected Digital Economy” will provide a tremendous boost, but there is much to be done to assist cities in using new investment sources to fund Smarter initiatives – or to develop sustainable commercial or social-enterprise business models to deliver them.

Although progress can be driven by strong leadership, the issues of governance and fragmented budgets will need to be overcome if we are to take full advantage of the benefits technology can bring.

We live in an era of major global challenges – well described in the recent “People and the Planet” report by the Royal Society. At the same time, we have access to powerful new technologies and ideas to address them, such as those proposed by the 100 Academics who contributed essays to the book “The New Optimists”. When we focus those resources on cities, we focus on the structures in which we can have the greatest impact on the most people.

Already many forward-looking cities in the UK such as Sunderland and Birmingham are joining others around the world by investing in Smarter systems. If we can meet the technical, organisational and investment challenges, we will not only provide citizens, businesses and agencies with new choices and exciting opportunities; we’ll also position the UK economy to succeed as the Information Revolution gathers pace.

Open Data isn’t free data

An early mashup using open data from Chicago’s police force

I support the principle of Open Data; and I’ve been creating commercial value from it since at least 2007, when as part of IBM’s Emerging Technologies team I developed scenarios to show how our customers could exploit it using early implementations of “Mashup” technology.

Here’s an example of what we were up to in those days, using alpha code for IBM Mashup Centre to integrate open data from Chicago’s public services with business data from insurance applications running in CICS. CICS is a transaction engine that’s now 43 years old and is used by 90% of Fortune 500 companies. When you take money out of a cashpoint, book an airline seat or renew your home insurance, there’s a decent chance CICS is involved somewhere. So there was (and is) vast economic potential in what we were doing.

But it’s not always straightforward to realise that value. It’s no accident we based our demonstration scenario in Chicago, which has long been at the leading edge of cities promoting Open Data. (It’s well worth catching up with how Chicago’s new CTO John Tolva is driving this agenda forwards, by the way). At the time, many other cities published similar data; but it wasn’t usable in the same way that Chicago’s was. It had been published in the form that was possible, cheaply, rather than in a form that was useful.

My point is: Open Data won’t deliver the value we all want it to unless we answer some hard questions. Such as:

Who will use Open Data, and why?

There are too many Open Data sites that don’t attract users and activity; so the investment in operating them doesn’t result in the creation of new value. That’s a shame; and we should try to understand why it happens. Often, I think it’s because they focus on making as much data as possible available in whatever form it’s in.

The Knight Commission report “The Information Needs of Communities” emphasised instead the need to consult with communities to find out what they need, rather than to publish data in anticipation of innovation. They are now publishing further guidance on implementing their ideas to promote open government.

Obviously, the problem with the extreme of this position is that if we restrict our Open Data efforts to providing only that data which is proven to be required through extensive consultation, we will limit the opportunity for spontaneous innovation. So a balance needs to be found.

How much does open data cost?

My experience building Open Data scenarios for our early Mashup technology taught me that high quality open data in a useable form was very rare. That’s because it’s expensive.

If producing highly usable information from the applications that manage the world’s information was easy or cheap, a good part of the IT industry would disappear overnight (whether you think that would be good or bad: it hasn’t happened). If we want usable data, we’re going to have to find ways and reasons to pay for it.

The cost to public sector organisations of processing Freedom of Information requests will sometimes provide the business case for spending money to open up data, but not always. Recent Government initiatives to make Open Data a criteria of future procurements will bake the cost of it into vendor proposals; but that won’t address the cost of opening up data from existing systems.

Finally, there will be many cases where clear value can be derived from open data; but not by the organisation that bears to cost of creating or distributing it. In order to balance the need for open innovation with the need to flow cost and revenue between organisations in a reasonable way, commercial models such as “freemium” will need to be explored. The “Dublinked” Open Data portal is doing that, for example.

How do we access and use Open Data?

As William Perrin argued recently, we need to think about how Open Data will be used beyond the community of technologists. I’ve blogged before about the need for technology and information to be accessible; and the need for our education system to provide us with the skills to use technology to manipulate and understand information. Those are both big challenges that we won’t overcome any time soon.

Where do we go next?

The potential value of Open Data is too great for us to afford to be negative, cynical or apathetic. Software automation and information technology are changing the way that value is created in the economy (see work on this from Imperial College and McKinsey), and the concept of Open Data is crucial to providing access to that potential across all sectors of society. But we will only realise that value if we find ways to addressing the cost of providing usable information; and to invest in making it accessible.

Acknowledgement: I’d like to thank Simon Whitehouse for discussions leading to this post, and for the link to William Perrin’s article.